

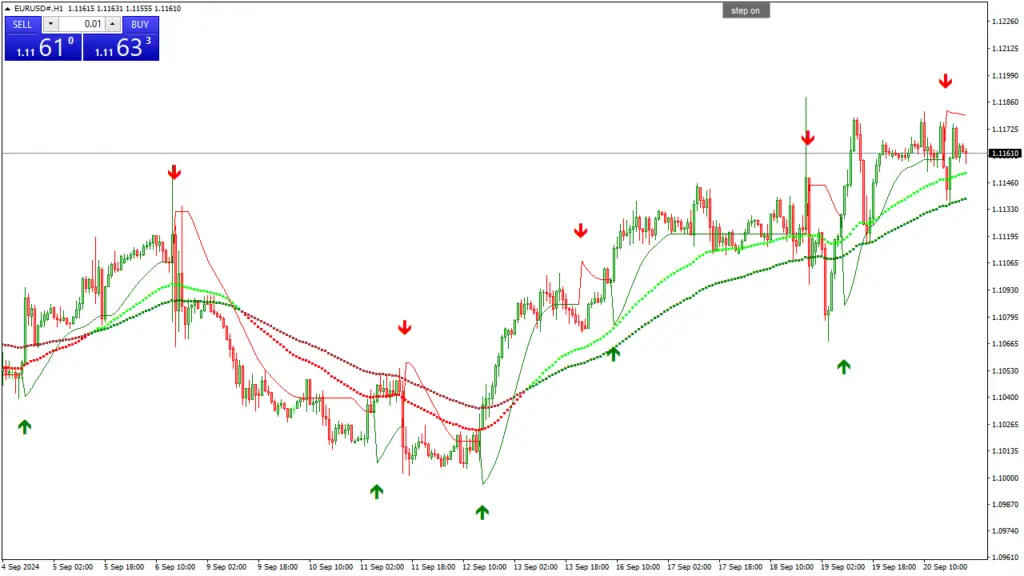
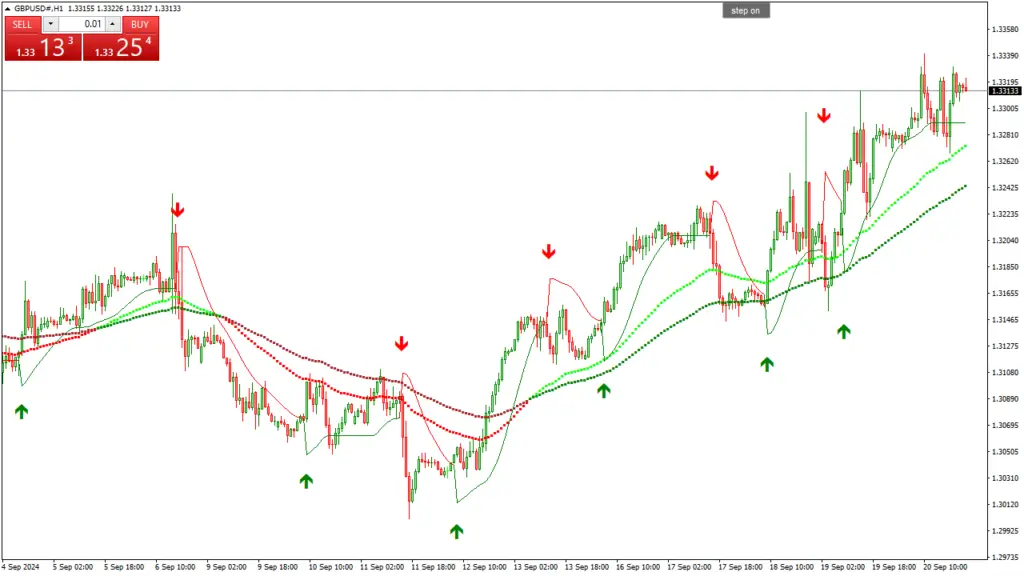
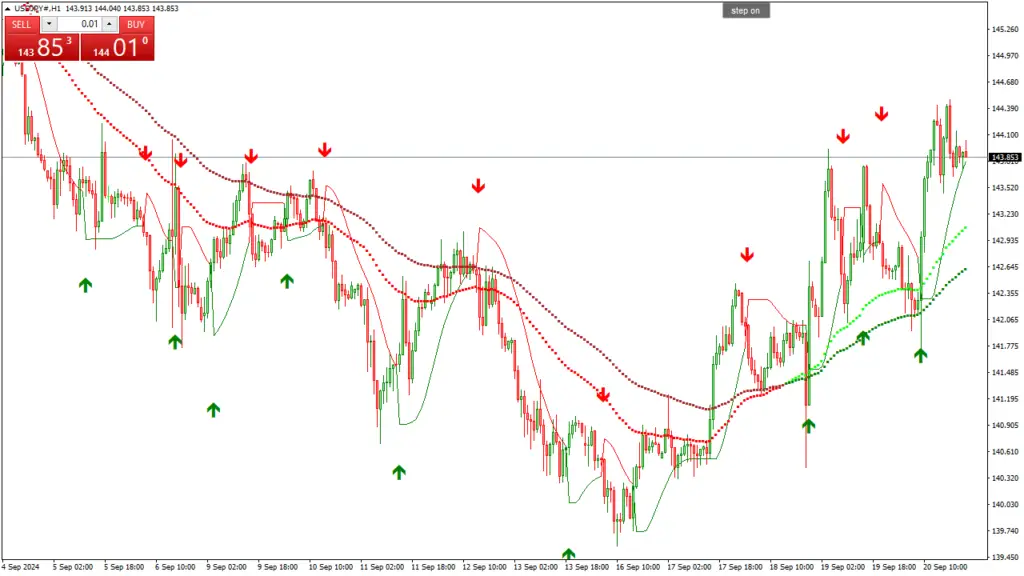
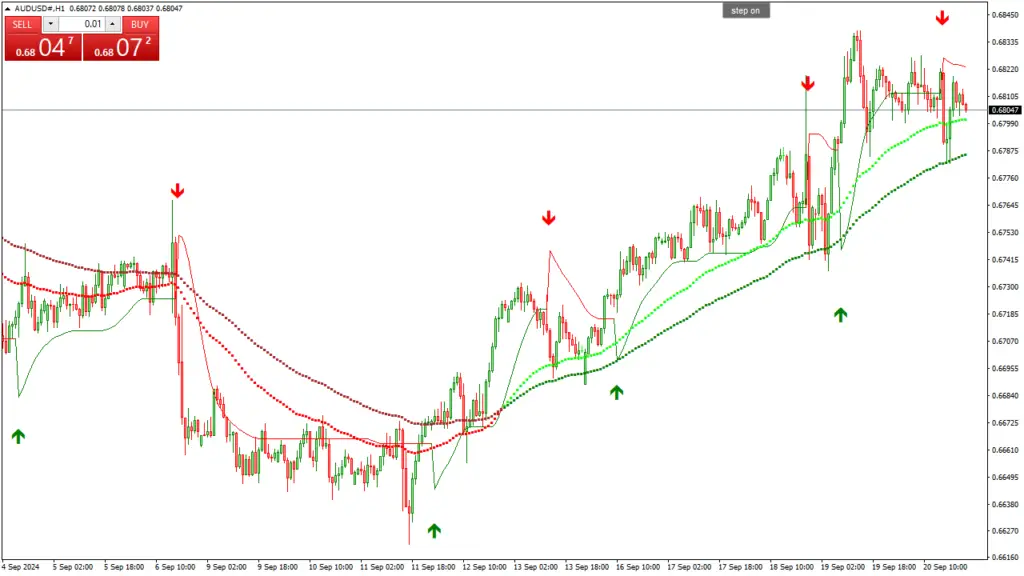
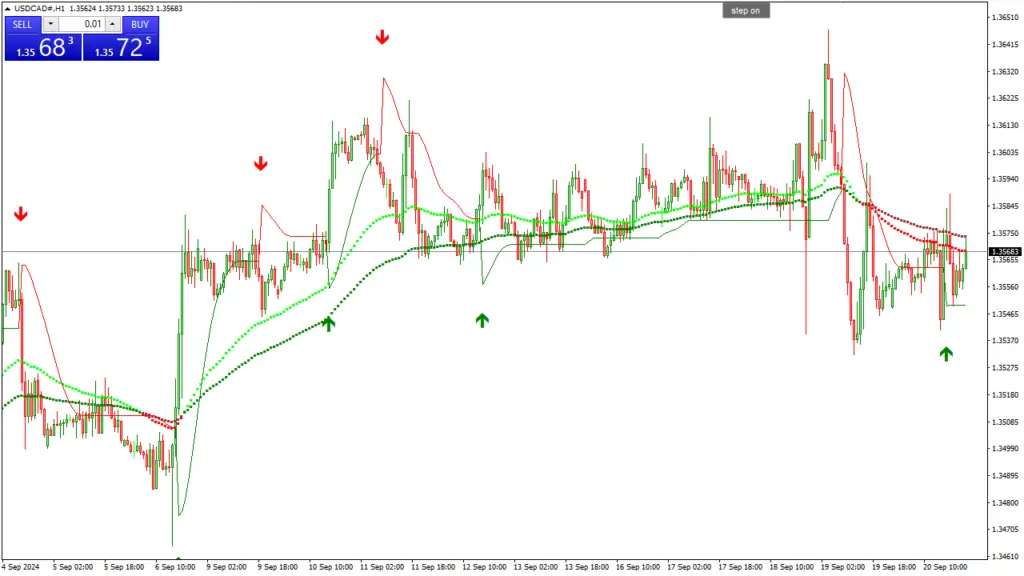
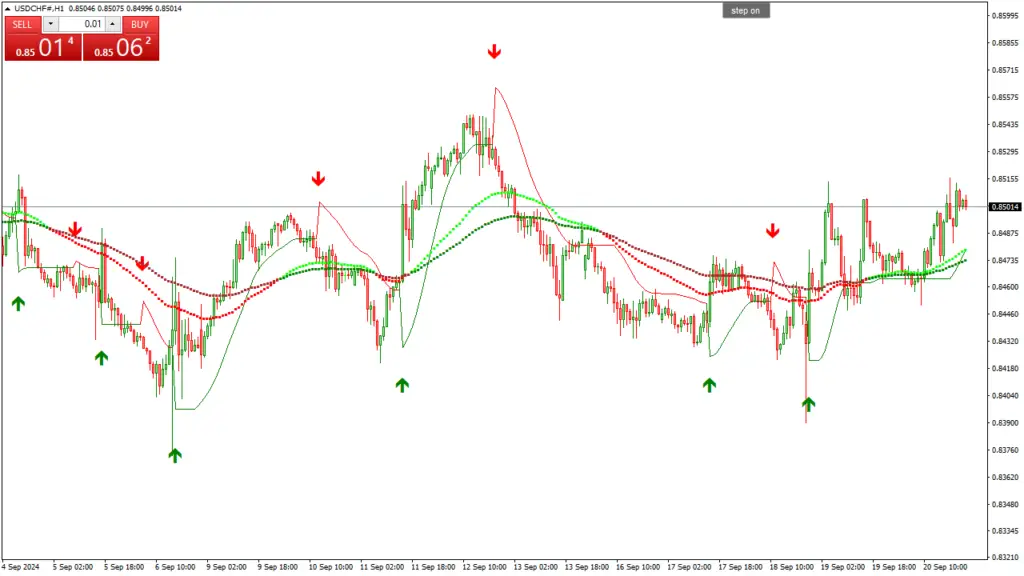
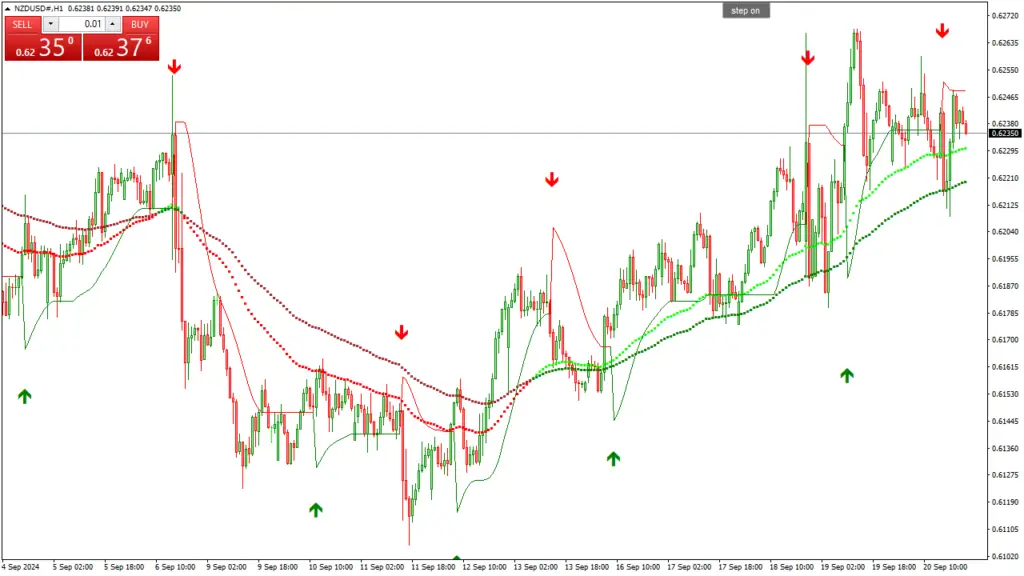
The Color EMA Strategy is a technical analysis tool employed by traders to identify market trends and pinpoint potential entry and exit points.
This strategy utilizes Exponential Moving Averages (EMAs), which assign greater weight to recent data points, thereby providing a more accurate representation of market fluctuations.
Contents
The Color EMA Strategy takes this concept further by incorporating multiple colored lines, each representing a distinct time frame of EMAs.
Enabling traders to visually discern trends and potential trading opportunities with ease.
The underlying principle of the Color EMA Strategy is that when a shorter-term EMA crosses above a longer-term EMA.
It signals a bullish trend, whereas a crossover in the opposite direction indicates a bearish trend.
By utilizing different colored lines for distinct time frames, traders can rapidly identify these crossover points and make informed trading decisions.
This strategy is particularly beneficial for traders who rely on visual cues and seek a straightforward yet effective method for identifying market trends.
How the Color EMA Strategy Differs from Traditional EMA
Enhanced Trend Identification
The Color EMA Strategy provides a clear visual representation of multiple EMAs, making it easier for traders to identify trends and potential trading opportunities.
This is in contrast to traditional EMA strategies, which can make it more challenging for traders to spot trends and make informed trading decisions.
Visual Aspect of Trading
The Color EMA Strategy places a strong emphasis on the visual aspect of trading. By using different colored lines for different time frames, traders can quickly and easily identify trend changes and potential entry and exit points.
This visual representation can be particularly helpful for traders who prefer a more intuitive approach to trading and are looking for a simple yet effective way to identify trends in the market.
A More Intuitive Approach to Trading
Overall, the Color EMA Strategy offers a more intuitive and effective way to identify trends and make informed trading decisions.
By providing a clear visual representation of multiple EMAs, traders can quickly and easily spot trends and potential trading opportunities. Making it an ideal strategy for those looking to improve their trading performance.
See Top Rated Forex T-shirt Just for You!

Solid colors: 100% Cotton; Heather Grey: 90% Cotton, 10% Polyester; Dark Heather and Heather Blue: 50% Cotton, 50% Polyester; OR Dark Heather, Heather Blue and All Other Heathers: 65% Polyester, 35% Cotton; Girls’ Heathers: 60% Cotton, 40% Polyester

Solid colors: 100% Cotton; Heather Grey: 90% Cotton, 10% Polyester; Dark Heather and Heather Blue: 50% Cotton, 50% Polyester; OR Dark Heather, Heather Blue and All Other Heathers: 65% Polyester, 35% Cotton; Girls’ Heathers: 60% Cotton, 40% Polyester

Solid colors: 100% Cotton; Heather Grey: 90% Cotton, 10% Polyester; Dark Heather and Heather Blue: 50% Cotton, 50% Polyester; OR Dark Heather, Heather Blue and All Other Heathers: 65% Polyester, 35% Cotton; Girls’ Heathers: 60% Cotton, 40% Polyester

Solid colors: 100% Cotton; Heather Grey: 90% Cotton, 10% Polyester; Dark Heather and Heather Blue: 50% Cotton, 50% Polyester; OR Dark Heather, Heather Blue and All Other Heathers: 65% Polyester, 35% Cotton; Girls’ Heathers: 60% Cotton, 40% Polyester

Solid colors: 100% Cotton; Heather Grey: 90% Cotton, 10% Polyester; Dark Heather and Heather Blue: 50% Cotton, 50% Polyester; OR Dark Heather, Heather Blue and All Other Heathers: 65% Polyester, 35% Cotton; Girls’ Heathers: 60% Cotton, 40% Polyester

Solid colors: 100% Cotton; Heather Grey: 90% Cotton, 10% Polyester; All Other Heathers: 50% Cotton, 50% Polyester

Solid colors: 100% Cotton; Heather Grey: 90% Cotton, 10% Polyester; All Other Heathers: 50% Cotton, 50% Polyester
Implementing the Color EMA Strategy in Your Trading
Implementing the Color EMA Strategy in your trading is relatively straightforward. The first step is to choose the time frames for the EMAs that you want to use.
This will depend on your trading style and preferences, but a common approach is to use a shorter-term EMA (such as 9 or 12 periods) and a longer-term EMA (such as 26 or 50 periods).
Once you have chosen your time frames, you can then apply the EMAs to your chart and assign different colors to each one.
Once the EMAs are in place, you can start looking for crossover points where the shorter-term EMA crosses above or below the longer-term EMA.
For example, if the shorter-term EMA crosses above the longer-term EMA, it may signal a bullish trend and a potential buying opportunity.
Conversely, if the shorter-term EMA crosses below the longer-term EMA, it may signal a bearish trend and a potential selling opportunity.
Advantages of Using the Color EMA Strategy
There are several advantages to using the Color EMA Strategy in your trading. One of the main advantages is its simplicity and ease of use.
The visual representation of multiple EMAs in different colors makes it easy for traders to identify trends and potential trading opportunities at a glance.
This can be particularly helpful for traders who prefer a more intuitive approach to trading and are looking for a simple yet effective way to identify trends in the market.
Another advantage is that the Color EMA Strategy can be used in conjunction with other technical analysis tools to confirm trading signals.
For example, traders can use support and resistance levels, chart patterns, and other indicators to confirm potential entry and exit points identified by the Color EMA Strategy.
This can help traders make more informed trading decisions and increase the likelihood of successful trades.
Common Mistakes to Avoid When Using the Color EMA Strategy
While the Color EMA Strategy can be a powerful tool for identifying trends and potential trading opportunities, there are some common mistakes that traders should avoid.
One common mistake is relying solely on the Color EMA Strategy without considering other factors that may impact the market.
It’s important to remember that no single indicator or strategy can guarantee success in trading.
So it’s important to use the Color EMA Strategy in conjunction with other technical analysis tools and fundamental analysis.
Another common mistake is using too many EMAs with different time frames, which can lead to confusion and conflicting signals.
It’s important to strike a balance between using enough EMAs to identify trends effectively and not using so many that it becomes overwhelming.
Traders should take the time to experiment with various combinations of Exponential Moving Averages (EMAs) and different time frames in order to determine what works best for their individual trading style and preferences.
By testing out different combinations, traders can gain a better understanding of how EMAs and time frames impact their trading strategies and ultimately find the most effective approach for their specific needs.
This process of experimentation and analysis can lead to improved trading performance and better decision-making in the market.
Real-life Examples of Successful Trades Using the Color EMA Strategy
Identifying Bullish Trends
A trader may have used the Color EMA Strategy to identify a bullish trend in a particular stock, leading them to enter a long position.
The Color EMA Strategy is a popular tool used by traders to identify potential exit points in a trend. By using this strategy, traders can lock in profits before the trend reverses.
This allows them to capitalize on the momentum of the market and avoid potential losses.
By staying ahead of the trend and using the Color EMA Strategy effectively, traders can maximize their profits and minimize their risks in the market.
Identifying Bearish Trends
In another example, a trader may have used the Color EMA Strategy to identify a bearish trend in a particular currency pair, leading them to enter a short position.
The Color EMA Strategy is a technical analysis tool that uses exponential moving averages to identify potential entry points for trading positions.
By utilizing this strategy, traders can take advantage of market trends and maximize their profits by entering short positions at opportune times.
This approach allows traders to capitalize on the momentum of a downward trend and potentially increase their returns as the trend continues.
Maximizing Profits
The Color EMA Strategy is a powerful tool for traders to effectively navigate the dynamic nature of the market.
By utilizing this strategy, traders can accurately identify and adapt to changing market trends, allowing them to capitalize on profitable opportunities and minimize potential losses.
This approach enables traders to make informed decisions based on the current market conditions, ultimately maximizing their profits and enhancing their overall trading performance.
Tips for Fine-tuning Your Color EMA Strategy for Maximum Effectiveness
To fine-tune your Color EMA Strategy for maximum effectiveness, there are several tips that traders can consider.
One tip is to experiment with different combinations of EMAs and time frames to find what works best for your trading style and preferences.
This may involve using shorter-term EMAs for more short-term trading opportunities or longer-term EMAs for more long-term trends.
Another tip is to use the Color EMA Strategy in conjunction with other technical analysis tools and fundamental analysis to confirm potential entry and exit points.
This can help traders make more informed trading decisions and increase the likelihood of successful trades.
The Color EMA Strategy can be a game changer for traders looking for a simple yet effective way to identify trends and potential trading opportunities in the market.
By understanding how the Color EMA Strategy works, implementing it in your trading, and avoiding common mistakes, you can increase your chances of success in the market.
With its visual representation of multiple EMAs in different colors, the Color EMA Strategy provides traders with a powerful tool for identifying trends and making informed trading decisions.
By fine-tuning your Color EMA Strategy and using it in conjunction with other technical analysis tools, you can maximize its effectiveness and increase your chances of successful trades.
Conclusion
In conclusion, the Color EMA Strategy presents a unique and visually engaging approach to trading that can enhance decision-making processes for both novice and experienced traders.
By incorporating color-coded exponential moving averages (EMAs), this strategy allows traders to quickly assess market trends and potential entry or exit points.
The use of colors not only simplifies the interpretation of data but also adds an intuitive layer to technical analysis, making it easier to identify bullish or bearish signals at a glance.
While the Color EMA Strategy can be a valuable tool in a trader’s arsenal, it is essential to remember that no strategy is foolproof.
Market conditions are inherently unpredictable, and relying solely on any single method can lead to significant risks.
Therefore, it is advisable for traders to combine the Color EMA Strategy with other analytical tools and risk management practices to create a well-rounded trading plan.
Moreover, continuous education and practice are crucial for mastering this strategy.
Traders should take the time to backtest their approaches, analyze past performance, and adapt their strategies based on changing market dynamics.
By doing so, they can refine their skills and improve their chances of success in the ever-evolving landscape of financial markets.
Ultimately, the Color EMA Strategy serves as an innovative way to visualize market trends while providing traders with actionable insights.
As with any trading strategy, diligence, patience, and ongoing learning will be key components in achieving long-term success.
Whether you are just starting your trading journey or looking to enhance your existing strategies, exploring the Color EMA Strategy could offer new perspectives and opportunities in your trading endeavors.


Leave a Reply