
Candlestick signals are a vital tool for traders in financial markets, offering valuable insights into the price action of a security over a specific period. Each candlestick represents the open, high, low, and close prices for a given time frame, such as a day, week, or month.
Contents
The candlestick’s body displays the open and close prices, while the wicks or shadows indicate the high and low prices. By analyzing the patterns formed by these candlesticks, traders can gain valuable insights into market sentiment and potential price movements.
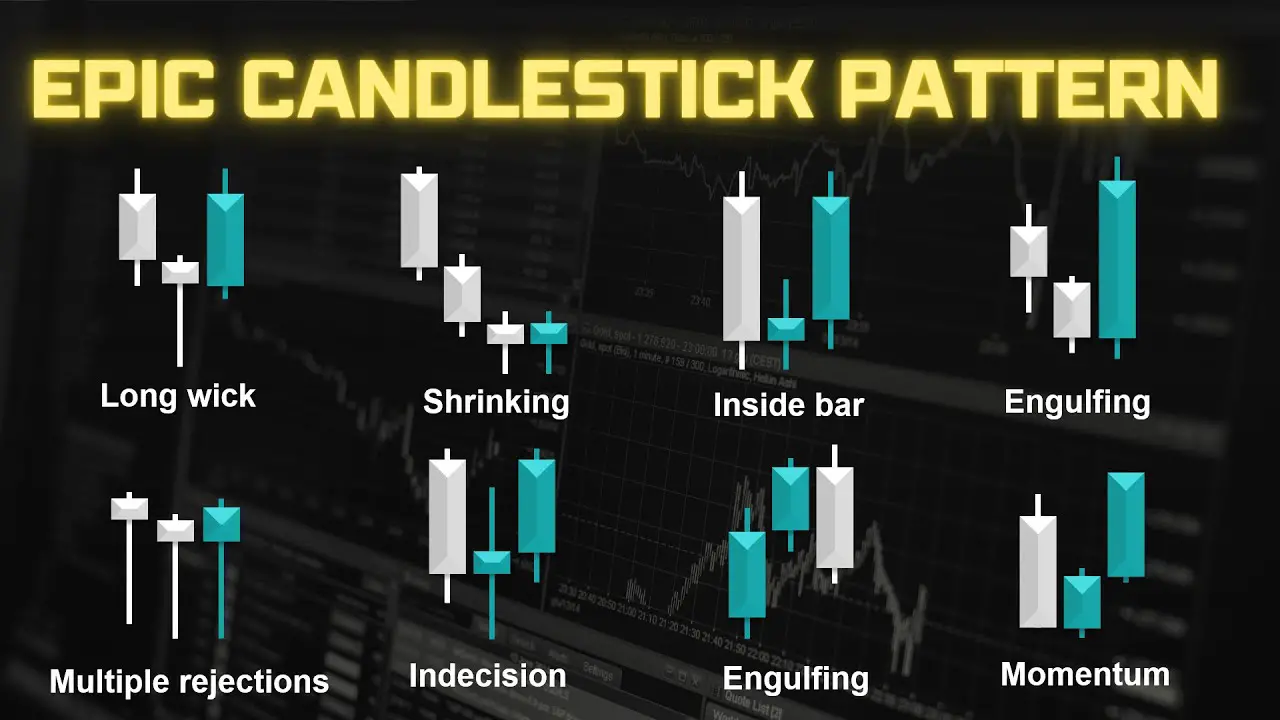
To accurately interpret candlestick signals, traders must first understand the basic patterns and their implications. For instance, a long green (or white) candlestick with a small wick at the top and no wick at the bottom indicates strong buying pressure and a bullish trend.
Conversely, a long red (or black) candlestick with a small wick at the bottom and no wick at the top suggests strong selling pressure and a bearish trend. These basic patterns provide essential information about the balance of power between buyers and sellers in the market.
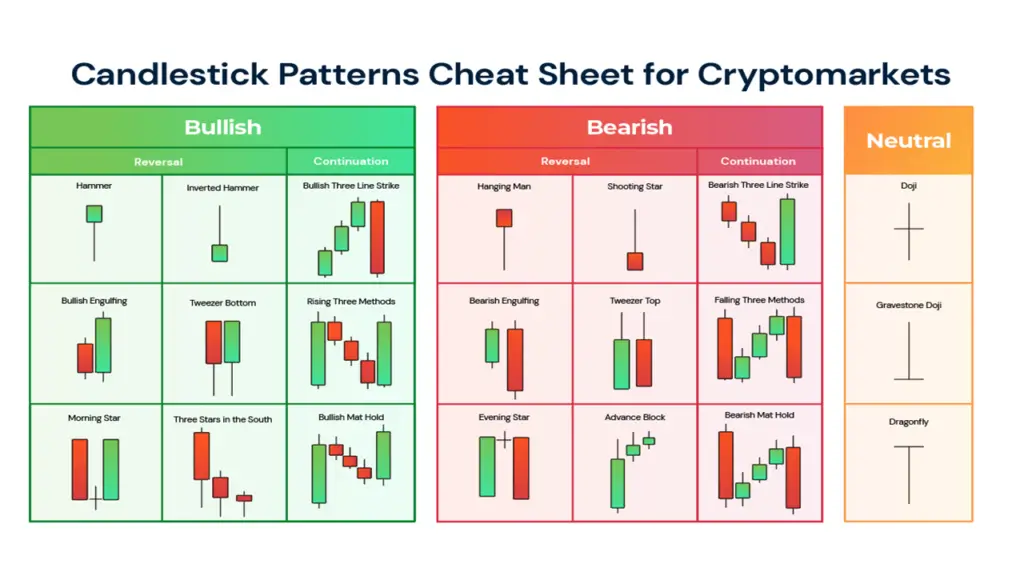
Identifying Key Candlestick Patterns
Indecision and Reversal: The Doji Pattern
One of the most well-known patterns is the “doji,” which occurs when the open and close prices are very close to each other, resulting in a small or non-existent body. This pattern indicates indecision in the market and can signal a potential reversal in trend.
Bullish Momentum: The Hammer Pattern
Another important pattern is the “hammer,” which has a small body at the top of the candlestick and a long lower wick. This pattern suggests that sellers pushed the price lower during the session, but buyers were able to push it back up, indicating potential bullish momentum.

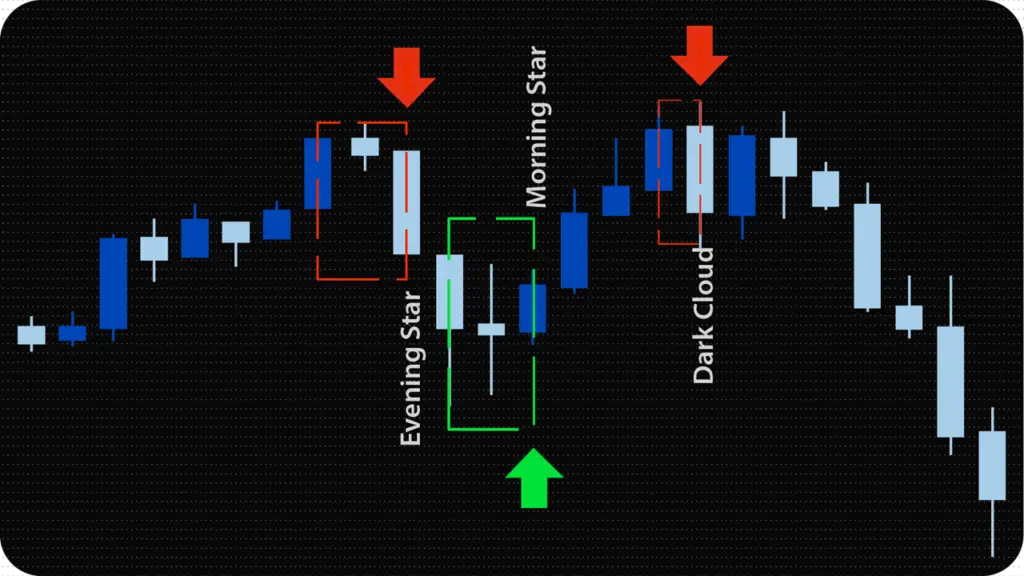
Reversal Patterns: Engulfing, Morning Star, and Evening Star
Other key patterns include the “engulfing pattern,” where a large candlestick completely engulfs the previous one, signaling a potential reversal, and the “morning star” and “evening star” patterns, which indicate potential reversals in bullish and bearish trends, respectively.
By learning to identify these key patterns, traders can gain valuable insights into potential market movements and make more informed trading decisions.

Using Candlestick Signals to Predict Market Trends
Candlestick signals can be used to predict market trends by identifying patterns that indicate potential reversals or continuations of existing trends.
For example, if a series of bullish candlestick patterns, such as “bullish engulfing” or “morning star,” form after a prolonged downtrend. It may signal a potential reversal in the market sentiment and the beginning of a new bullish trend.
Conversely, if a series of bearish patterns, such as “bearish engulfing” or “evening star,” form after an extended uptrend, it may indicate a potential reversal and the start of a new bearish trend.
Traders can also use candlestick signals to confirm existing trend directions. For instance, if a series of bullish candlestick patterns form in an uptrend, it can provide confirmation that the bullish trend is likely to continue.
Similarly, if bearish patterns appear in a downtrend, it can confirm that the bearish trend is likely to persist.
By using candlestick signals in conjunction with other technical analysis tools, such as moving averages or trend lines. Traders can gain a more comprehensive understanding of market trends and make more accurate predictions.
Interpreting Candlestick Signals for Entry and Exit Points
One of the most valuable applications of candlestick signals is in determining entry and exit points for trades.
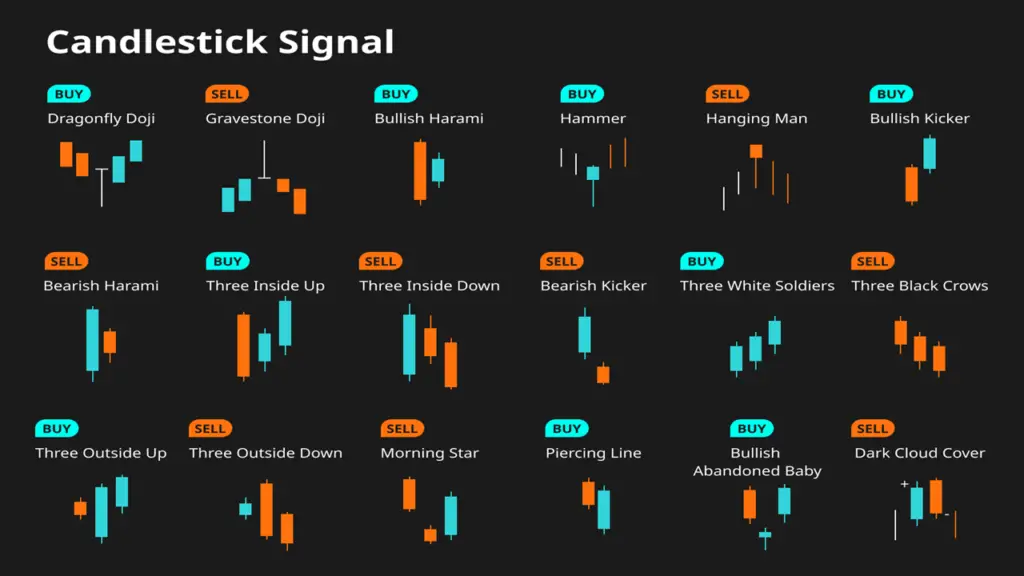
For example, if a trader identifies a bullish reversal pattern, such as a “hammer” or “bullish engulfing,” after a prolonged downtrend, it may signal an opportune time to enter a long position.
Conversely, if a bearish reversal pattern, such as a “shooting star” or “bearish engulfing,” forms after an extended uptrend, it may indicate an ideal opportunity to exit a long position or enter a short position. In addition to reversal patterns, traders can also use continuation patterns to identify entry and exit points.

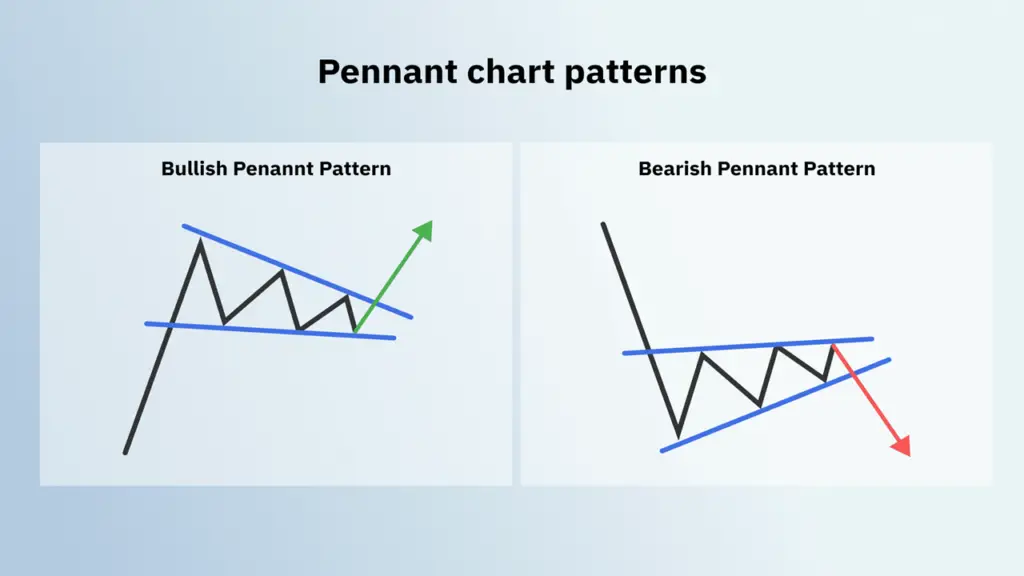
For instance, if a security is in an uptrend and forms a “bull flag” pattern, which consists of a small consolidation period after a strong upward move. It may signal an opportunity to enter a long position before the trend continues.
Similarly, if a security is in a downtrend and forms a “bear flag” pattern, it may indicate an ideal time to enter a short position before the downtrend resumes. By effectively interpreting candlestick signals for entry and exit points, traders can improve their timing and increase their profitability.
Common Mistakes to Avoid When Reading Candlestick Signals
1. Ignoring the overall trend: It is important to consider the overall trend of the market before making any trading decisions based on candlestick signals. A bullish candlestick pattern may not be significant if it occurs in a bearish market, and vice versa.
2. Focusing too much on individual candlesticks: While individual candlestick patterns can provide valuable information, it is important to consider them in the context of the surrounding price action and other technical indicators. A single candlestick pattern should not be the sole basis for making a trading decision.
3. Not considering the timeframe: Candlestick patterns can vary in significance depending on the timeframe being analyzed. A pattern that appears significant on a daily chart may not be as relevant on a shorter timeframe, such as an hourly or 15-minute chart.
4. Overlooking confirmation signals: It is important to look for confirmation signals before acting on a candlestick pattern. This can include waiting for a close above or below a certain level, or waiting for additional indicators to confirm the signal.

5. Failing to set stop-loss orders: It is important to always have a stop-loss order in place when trading based on candlestick signals. This helps to limit potential losses if the trade goes against you.
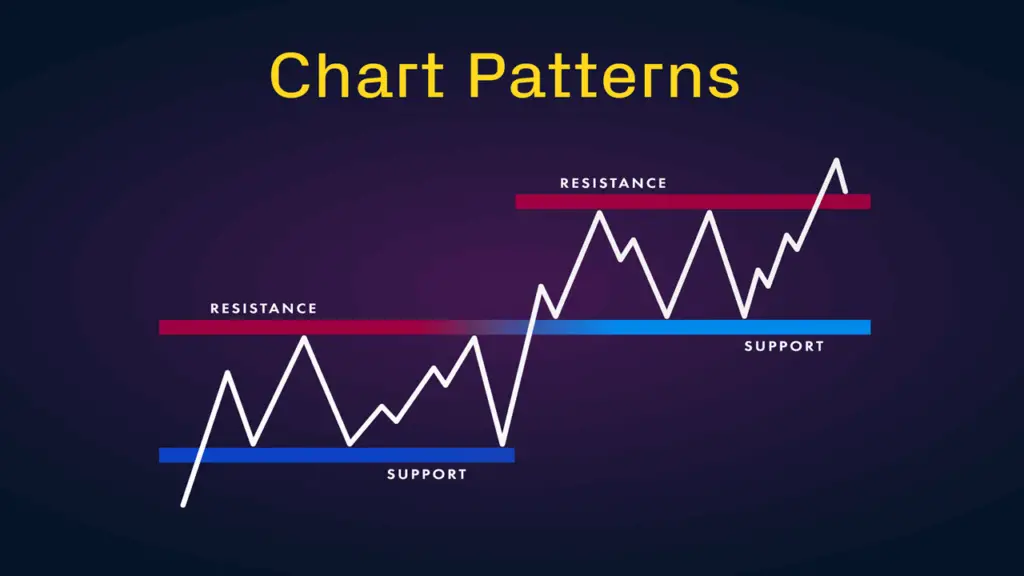
6. Not considering other factors: Candlestick patterns should be used in conjunction with other technical analysis tools and indicators. Ignoring other factors such as support and resistance levels, volume, and trendlines can lead to inaccurate interpretations of candlestick signals.
7. Overtrading: It is important to avoid overtrading based solely on candlestick signals. It is better to wait for high-probability setups that align with other technical analysis factors before entering a trade.
8. Not practicing proper risk management: Risk management is crucial when trading based on candlestick signals or any other form of technical analysis. It is important to determine your risk tolerance and set appropriate position sizes and stop-loss levels to protect your capital.
9. Failing to adapt to changing market conditions: Market conditions can change quickly, and candlestick patterns that were once reliable may lose their effectiveness. It is important to constantly evaluate and adapt your trading strategy based on current market conditions.
10. Relying solely on candlestick patterns: While candlestick patterns can provide valuable insights into market sentiment, they should not be the sole basis for making trading decisions. It is important to consider other forms of technical analysis, fundamental analysis, and market news when making trading decisions.
Advanced Strategies for Utilizing Candlestick Signals
In addition to basic entry and exit strategies, there are several advanced techniques for utilizing candlestick signals to improve trading performance. One advanced strategy is using multiple timeframes to confirm signals.
For example, if a bullish reversal pattern forms on a daily chart, traders can look for confirmation on shorter timeframes, such as hourly or 15-minute charts, before entering a trade. This can help filter out false signals and increase the probability of successful trades.
Another advanced strategy is combining candlestick signals with other technical analysis tools, such as Fibonacci retracements or pivot points, to identify key support and resistance levels.
By aligning candlestick signals with these levels, traders can gain additional confirmation for their trading decisions and improve their risk management.
Additionally, advanced traders may use candlestick signals in conjunction with fundamental analysis to identify potential catalysts for price movements and make more informed trading decisions.
Improving Your Trading Performance with Candlestick Signals
To improve trading performance with candlestick signals, traders should focus on continuous learning and practice. This includes studying different candlestick patterns and their interpretations, as well as practicing identifying these patterns on historical price charts.
Additionally, traders should backtest their strategies using historical data to assess their effectiveness and make necessary adjustments. Furthermore, it’s essential for traders to develop discipline and patience when using candlestick signals.
This includes waiting for confirmation from multiple indicators before entering trades and being prepared to cut losses quickly if the market moves against them. By maintaining discipline and managing risk effectively, traders can maximize their profitability while minimizing potential losses.

Conclusion
In conclusion, reading candlestick signals is an essential skill for traders in the financial markets. By understanding the basics of candlestick signals, identifying key patterns, using them to predict market trends, interpreting them for entry and exit points, avoiding common mistakes, utilizing advanced strategies.
And continuously improving trading performance with them, traders can gain valuable insights into market dynamics and make more informed trading decisions. With practice and discipline, traders can harness the power of candlestick signals to enhance their profitability and achieve success in their trading endeavors.


Leave a Reply