The Power Heiken Ashi have been in place for a long time, trading has long been a delicate dance of deciphering market sentiment and predicting price movements. Traditional Japanese candlesticks have served as the go-to visualization for traders, offering a glimpse into market psychology.
Contents
However, amidst the chaos of price fluctuations, many traders seek a more refined and smoother approach to price analysis. Enter Heikin Ashi—a powerful yet underappreciated charting technique that enhances trend visibility and reduces market noise, offering traders a more comprehensive understanding of price action.
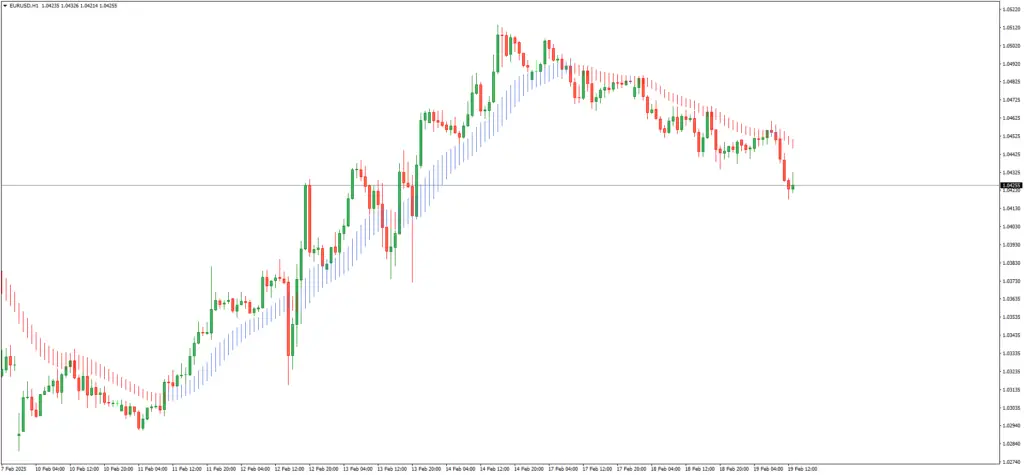
Understanding Heikin Ashi
The term Heikin Ashi originates from Japanese, meaning “average bar.” Unlike traditional candlesticks, which depict raw price fluctuations, Heikin Ashi modifies price data using a unique averaging formula.
This transformation smooths erratic price movements, making trends easier to follow. Developed to counteract the inherent noise in traditional candlestick charts, Heikin Ashi provides a refined perspective that allows traders to make better-informed decisions.
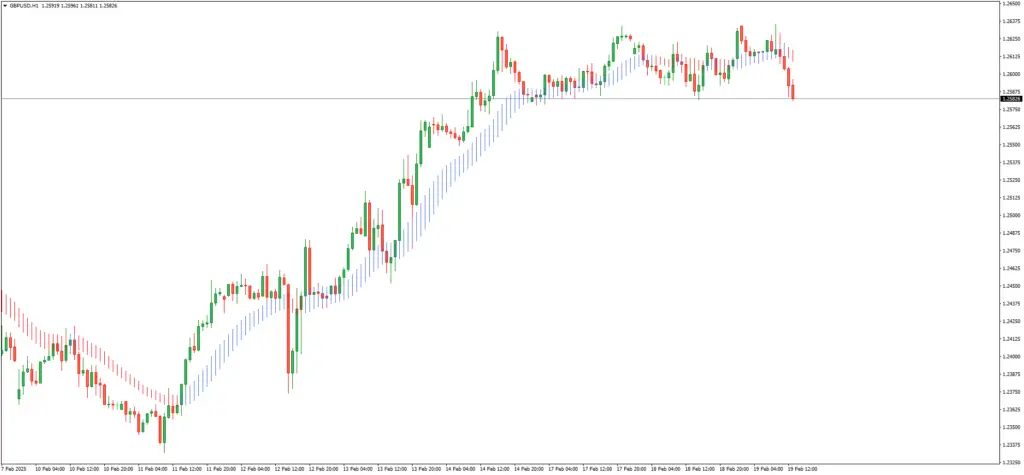
The Mechanics of Heikin Ashi Candles
Understanding the structural differences between Heikin Ashi and traditional candlesticks is key to harnessing its power. Each Heikin Ashi candle is constructed using a specific formula:
- Open = (Previous Open + Previous Close) / 2
- Close = (Open + High + Low + Close) / 4
- High = Maximum value among Open, Close, and High
- Low = Minimum value among Open, Close, and Low
This methodology results in a smoother transition between candlesticks, reducing market noise and forming a more visually cohesive trend structure.
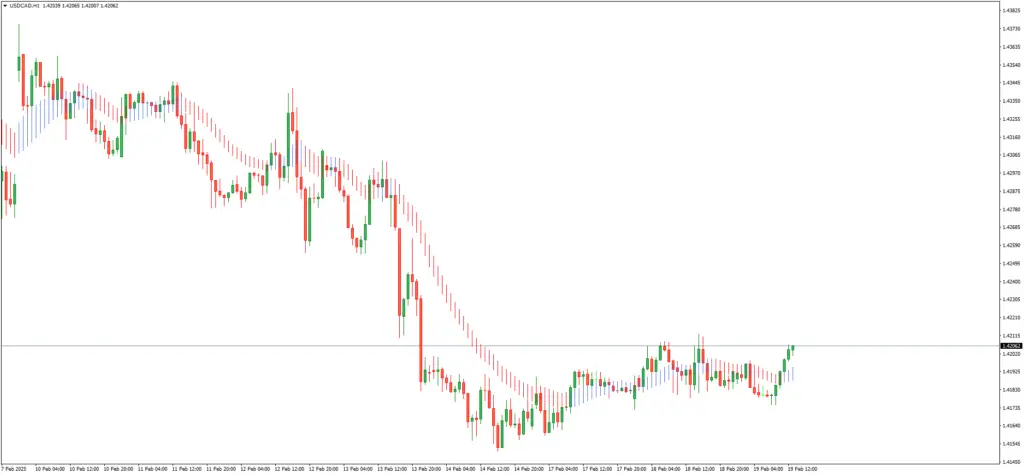
Bullish candles appear consistently green in an uptrend, while bearish trends maintain a sequence of red candles—eliminating the choppiness often seen in standard candlestick charts.
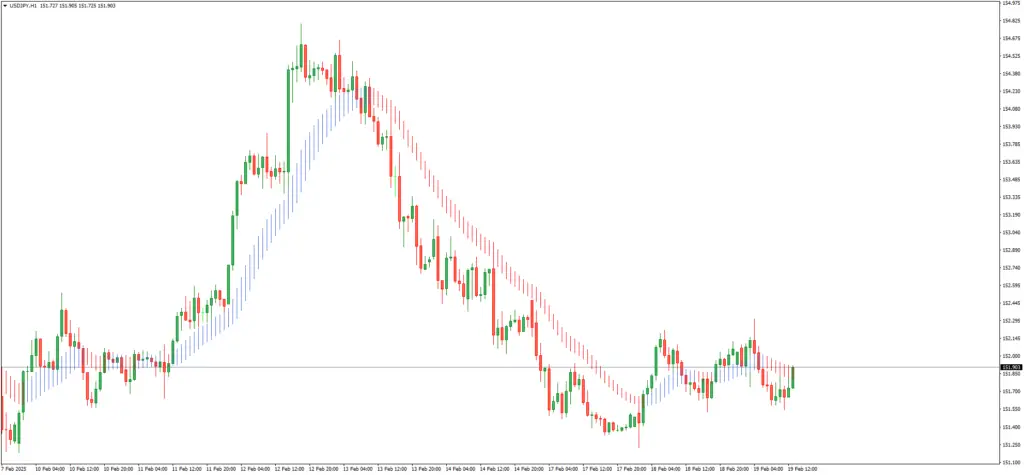
Advantages of Heikin Ashi in Trading
Heikin Ashi’s strength lies in its ability to filter out market noise and highlight dominant trends. This provides several key advantages:
- Enhanced Trend Identification: By reducing erratic fluctuations, Heikin Ashi makes it easier to distinguish uptrends, downtrends, and consolidations.
- Clearer Entry and Exit Points: Unlike traditional candlesticks, where wicks and gaps can cause confusion, Heikin Ashi provides a more stable framework for decision-making.
- Better Risk Management: Traders can avoid false signals that often plague traditional candlestick analysis, leading to more calculated trade execution.
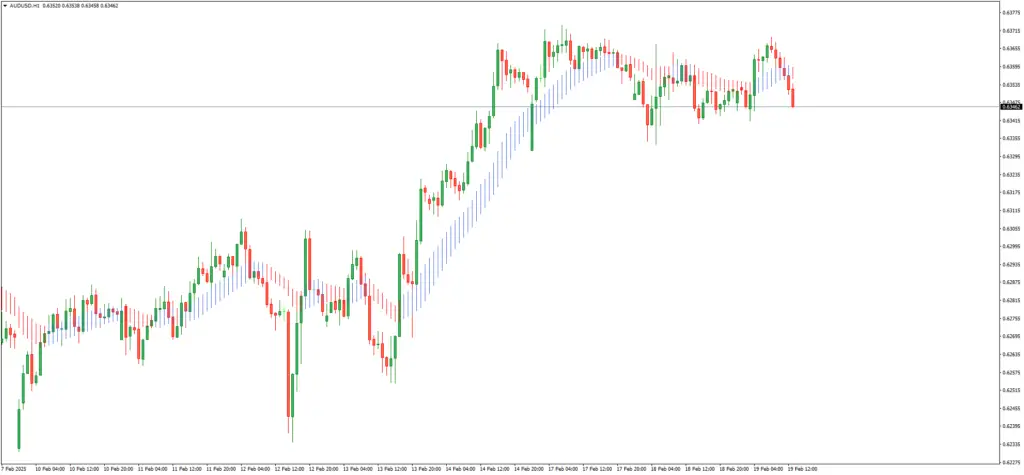
Heikin Ashi Strategies for Maximum Effectiveness
Implementing Heikin Ashi into a trading strategy requires a well-defined approach. Several proven strategies stand out:
- Trend-Following Strategy: Traders enter long positions when Heikin Ashi candles turn green in an uptrend and exit when a red candle emerges, signaling a potential reversal.
- Reversal Signals: Heikin Ashi wicks indicate indecision—long upper wicks can signal an impending bearish reversal, while long lower wicks suggest bullish momentum.
- Breakout Confirmation: When a strong Heikin Ashi candle breaks out from a consolidation zone, it often confirms a valid trend continuation.
Limitations and Risks of Heikin Ashi
Despite its advantages, Heikin Ashi is not without its drawbacks:
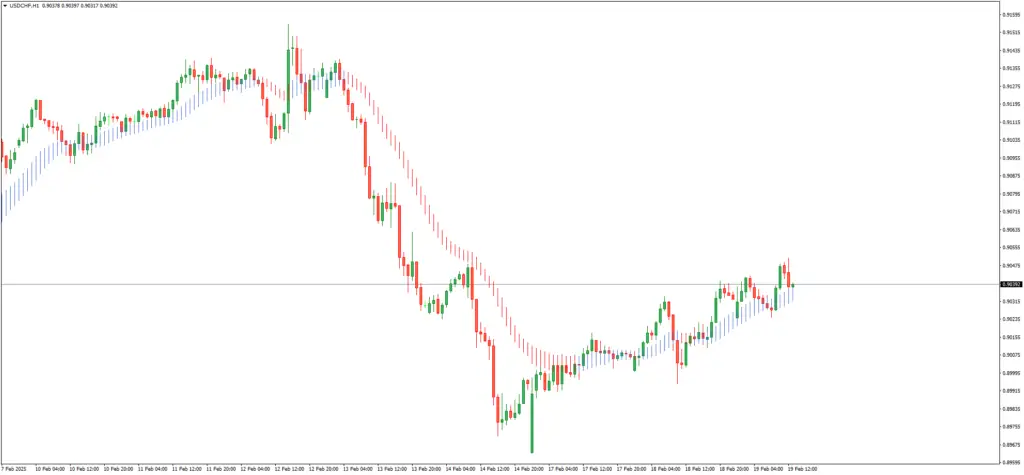
- Lagging Nature: Due to its averaging mechanism, Heikin Ashi lags behind real-time price action, making it unsuitable for scalping or high-frequency trading.
- Less Effective in Ranging Markets: In sideways conditions, Heikin Ashi may fail to provide accurate signals, as its smoothing function can obscure minor price movements.
- Limited Use for Precise Order Placement: Since Heikin Ashi alters traditional open and close prices, traders must rely on raw price data for accurate stop-loss and take-profit placements.
Combining Heikin Ashi with Other Indicators
To enhance its effectiveness, Heikin Ashi is often paired with other technical indicators:
- Moving Averages: Using the 50-period or 200-period moving average alongside Heikin Ashi can confirm trend strength and direction.
- Relative Strength Index (RSI): RSI helps determine overbought or oversold conditions, complementing Heikin Ashi’s trend-based signals.
- MACD (Moving Average Convergence Divergence): When MACD confirms a bullish or bearish crossover alongside Heikin Ashi trend shifts, it strengthens trade confidence.
Conclusion
Heikin Ashi is a formidable tool for traders who seek clearer trend visualization and reduced market noise. While it is not a standalone trading solution, when combined with other indicators, it becomes a powerful asset in a trader’s arsenal.
Understanding its strengths, limitations, and ideal use cases allows traders to harness its full potential and make more informed trading decisions. Whether used for swing trading, trend confirmation, or momentum analysis, Heikin Ashi continues to be a valuable addition to modern technical analysis strategies.


Leave a Reply