
Chart patterns are a crucial component of technical analysis, providing traders with valuable insights into potential future price movements of a security.
Formed by the price fluctuations of a security over time, these patterns can be instrumental in informing investment decisions.
Contents
By accurately identifying and interpreting chart patterns, traders can gain a competitive advantage, increasing their chances of success in the market.
The various shapes and sizes of chart patterns, including head and shoulders, triangles, and flags, each possess distinct characteristics and implications.
This article will delve into 12 essential chart patterns that traders should be familiar with to optimize their market performance.

Understanding the Importance of Chart Patterns in Trading
Understanding Market Sentiment
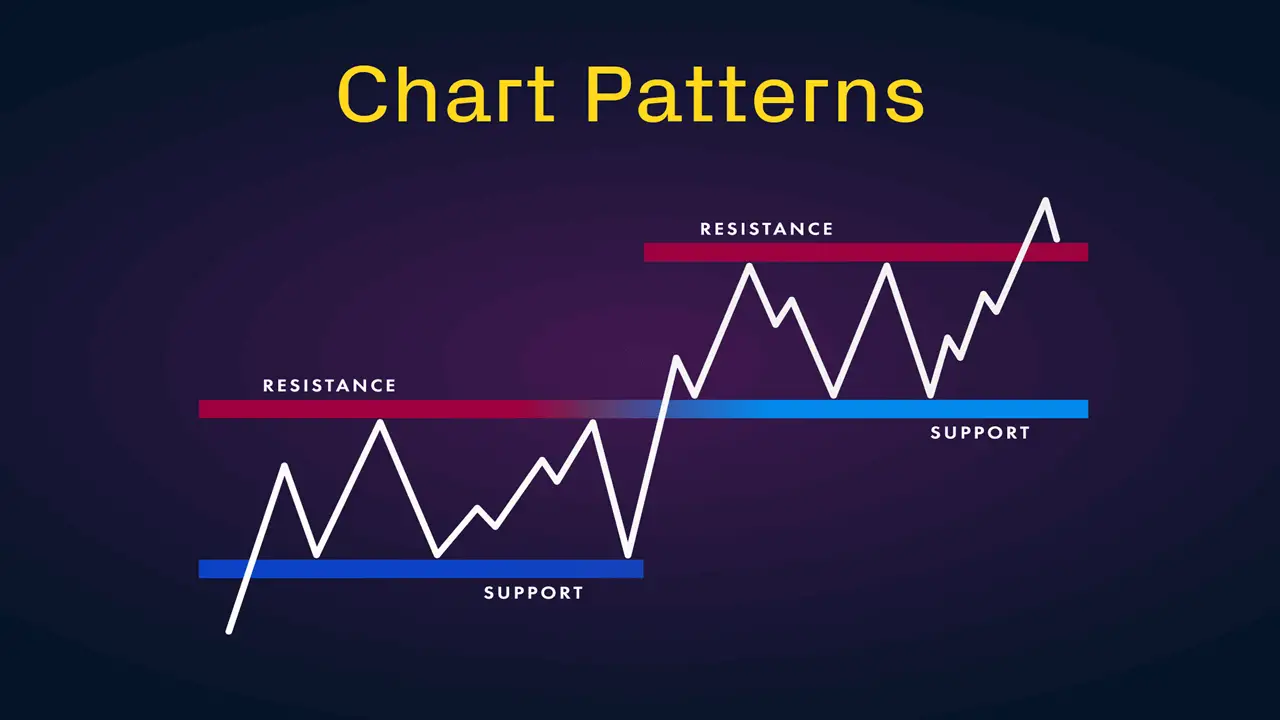
Chart patterns help traders gain valuable insights into market sentiment and potential price trends.
By identifying and interpreting these patterns, traders can develop a deeper understanding of the market and make more accurate predictions.
Identifying Trading Opportunities
Chart patterns can also help traders identify potential entry and exit points, as well as set stop-loss and take-profit levels.
This information is essential for developing a strategic approach to trading and increasing the chances of success in the market.
Improving Trading Performance
By understanding the importance of chart patterns in trading, traders can refine their skills and improve their overall trading performance.
With the ability to make more informed decisions, traders can increase their confidence and achieve their trading goals.
12 Essential Chart Patterns for Successful Trading
1. Head and Shoulders Pattern: This pattern is formed by three peaks, with the middle peak being the highest. It is a bearish reversal pattern that indicates a potential trend reversal from bullish to bearish.
2. Double Top and Double Bottom: These patterns are formed by two peaks or two troughs, respectively. They indicate a potential trend reversal and can be used to identify entry and exit points.
3. Triangles: Triangles are formed by converging trendlines and indicate a period of consolidation before a potential breakout or breakdown.
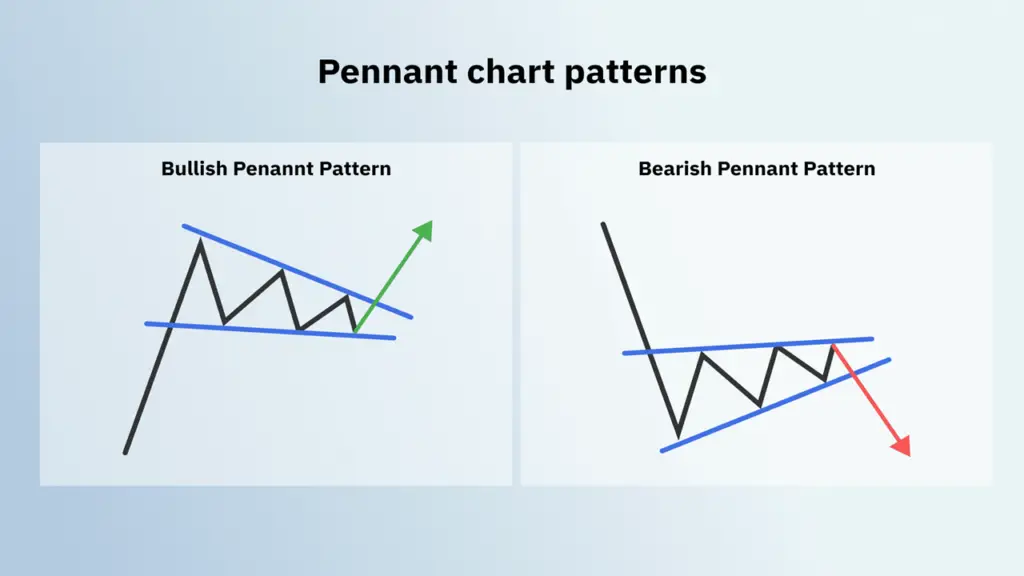
4. Flags and Pennants: These patterns are continuation patterns that indicate a brief pause in the trend before resuming in the same direction.
5. Cup and Handle: This pattern is a bullish continuation pattern that indicates a potential upward trend continuation after a brief consolidation period.
6. Wedges: Wedges are formed by converging trendlines and can be either bullish or bearish, depending on their direction.
7. Rectangles: Rectangles are formed by parallel trendlines and indicate a period of consolidation before a potential breakout or breakdown.
8. Triple Top and Triple Bottom: These patterns are similar to double tops and double bottoms but are formed by three peaks or three troughs, respectively.
9. Head and Shoulders Inverse: This pattern is the opposite of the head and shoulders pattern and is a bullish reversal pattern that indicates a potential trend reversal from bearish to bullish.
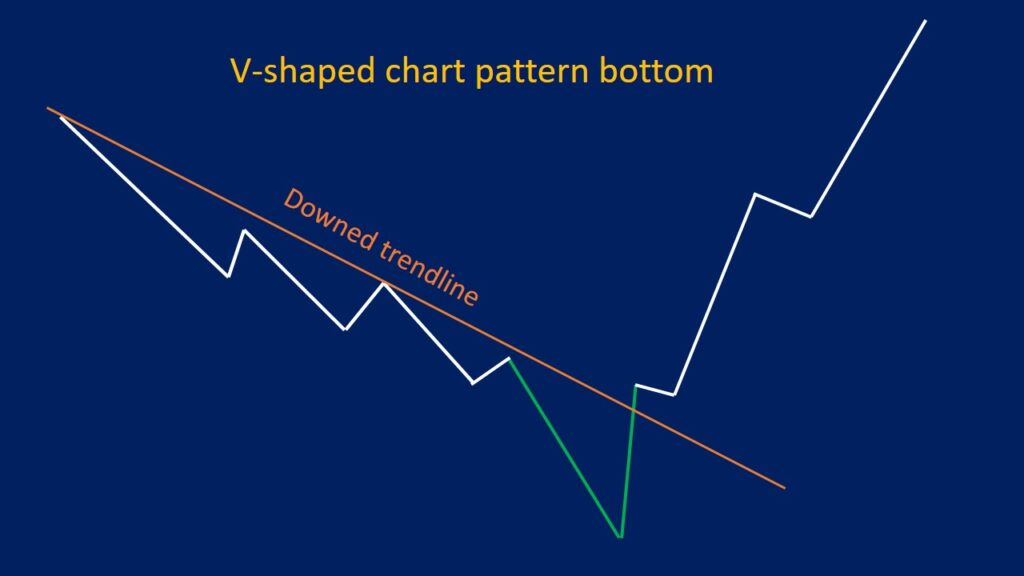
10. Rounding Bottom: This pattern is a bullish reversal pattern that indicates a potential trend reversal from bearish to bullish.
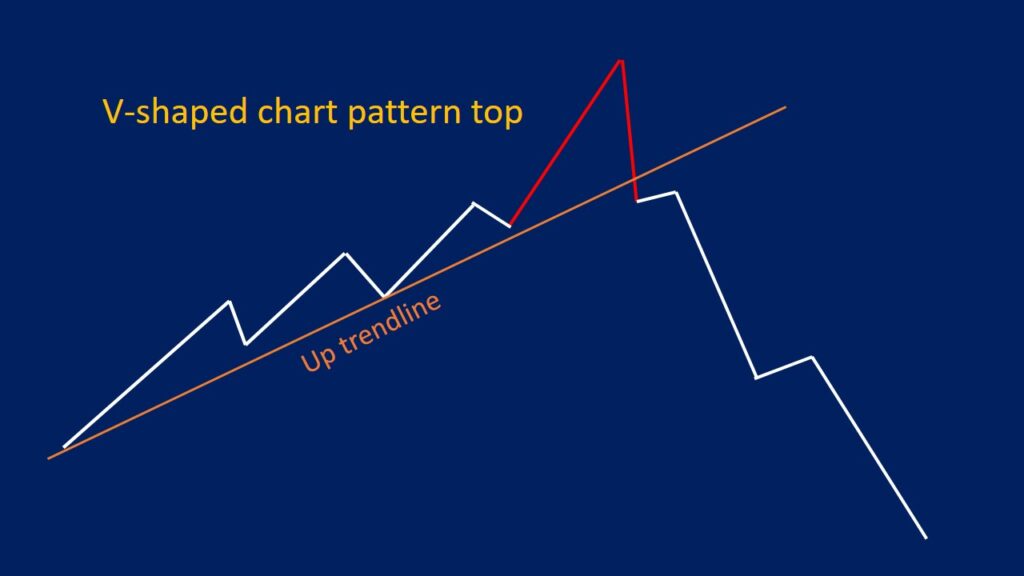
11. Rounding Top: This pattern is the opposite of the rounding bottom and is a bearish reversal pattern that indicates a potential trend reversal from bullish to bearish.
12. Gaps: Gaps are spaces between the closing price of one period and the opening price of the next period. They can indicate potential support or resistance levels and can be used to identify entry and exit points.
How to Identify and Interpret Chart Patterns
| Chart Pattern | Description | Success Rate |
|---|---|---|
| Head and Shoulders | A reversal pattern indicating a bullish-to-bearish trend change | 70% |
| Double Top | Reversal pattern signaling a potential bearish trend | 65% |
| Double Bottom | Reversal pattern indicating a potential bullish trend | 60% |
| Triangle | Continuation pattern showing a period of consolidation before the previous trend continues | 75% |
| Flag | Continuation pattern indicating a brief consolidation before the previous trend resumes | 80% |
| Pennant | Similar to a flag, a pennant is a continuation pattern with a brief consolidation before the previous trend continues | 75% |
| Wedge | Reversal pattern showing a tightening range and potential trend change | 70% |
| Cup and Handle | Continuation pattern indicating a bullish trend continuation after a brief consolidation | 85% |
| Triple Top | Reversal pattern signaling a potential bearish trend change | 60% |
| Triple Bottom | Reversal pattern indicating a potential bullish trend change | 65% |
| Rounding Bottom | Reversal pattern showing a gradual shift from a bearish to a bullish trend | 70% |
| Rising Wedge | Reversal pattern indicating a tightening range and potential bearish trend change | 65% |
Identifying and interpreting chart patterns requires a keen eye for detail and an understanding of market dynamics.
Traders can use various technical analysis tools, such as trendlines, moving averages, and volume indicators, to identify and confirm chart patterns.
Once a pattern is identified, traders can interpret its implications by analyzing its shape, size, and duration, as well as its location within the overall market trend.
For example, a head and shoulders pattern located at the end of an uptrend may indicate a potential trend reversal, while the same pattern located within a downtrend may indicate a continuation of the current trend.
By understanding how to identify and interpret chart patterns, traders can gain valuable insights into potential future price movements and make more informed trading decisions.
Traders can use these patterns to identify potential entry and exit points, set stop-loss and take-profit levels, and confirm their overall market analysis.
For example, a trader may use a head and shoulders pattern to identify a potential entry point for a short position, with a stop-loss level set above the pattern’s neckline.
Similarly, a trader may use a cup and handle pattern to confirm a bullish market trend and set a take-profit level at the pattern’s projected price target.
By using chart patterns to make informed trading decisions, traders can increase their chances of success in the market and improve their overall trading performance.
Common Mistakes to Avoid When Trading Chart Patterns
Avoiding Overreliance on Chart Patterns
One common mistake is relying too heavily on chart patterns without considering other technical analysis tools or fundamental factors that may impact market dynamics.
Beware of False Signals
Traders should also be cautious of false signals, which can occur when a pattern fails to confirm its implications or when market conditions change unexpectedly.
Overtrading and Increased Risk
Additionally, traders should avoid overtrading based on chart patterns alone, as this can lead to increased risk and potential losses.
By being aware of these common mistakes, traders can develop a more strategic approach to using chart patterns in their trading strategy and improve their overall trading performance.
Tips for Incorporating Chart Patterns into Your Trading Strategy
Incorporating chart patterns into your trading strategy requires careful consideration and strategic planning.
Traders should start by familiarizing themselves with the various chart patterns and their implications, as well as how to identify and interpret these patterns effectively.
It is also important for traders to use chart patterns in conjunction with other technical analysis tools, such as trendlines, moving averages, and volume indicators, to confirm their overall market analysis.
Additionally, traders should consider the broader market context when using chart patterns in their trading strategy, as market conditions can impact the reliability of these patterns.
By incorporating these tips into their trading strategy, traders can develop a more strategic approach to using chart patterns and increase their chances of success in the market.
In conclusion, chart patterns are an essential tool for traders looking to make informed decisions in the stock market.
By understanding and interpreting these patterns, traders can gain valuable insights into potential future price movements and improve their overall trading performance.
However, it is important for traders to be aware of common mistakes when using chart patterns in their trading strategy and to incorporate these patterns strategically into their overall market analysis.
By doing so, traders can increase their chances of success in the market and develop a more strategic approach to their trading.
FAQs
What are chart patterns in trading?
Chart patterns in trading are specific formations that appear on a price chart and are used by traders to predict future price movements. These patterns are formed by the movements of the price and can indicate potential buy or sell signals.
How many chart patterns are mentioned in the article “12 Chart Patterns for Traders | A Complete Success”?
The article “12 Chart Patterns for Traders | A Complete Success” mentions 12 different chart patterns that traders can use to make informed trading decisions.
What is the purpose of using chart patterns in trading?
The purpose of using chart patterns in trading is to identify potential opportunities for buying or selling assets based on the historical price movements and patterns that have been observed in the market.
Are chart patterns a guaranteed way to make successful trades?
No, chart patterns are not a guaranteed way to make successful trades. While they can provide valuable insights into potential price movements, trading always involves a level of risk and uncertainty.
How can traders use chart patterns to make informed decisions?
Traders can use chart patterns to make informed decisions by studying the historical patterns and understanding the potential implications for future price movements. This can help them identify potential entry and exit points for their trades.
Conclusion
In conclusion, mastering the 12 chart patterns for traders is an indispensable skill for anyone serious about navigating the financial markets.
These patterns—Head and Shoulders, Double Top and Bottom, Cup and Handle, Rounding Bottom, Wedges, Pennants, Flags, Triangles, Rectangles, Gaps, Triple Top and Bottom, and the Ascending and Descending Channels—serve as critical tools in a trader’s arsenal.
Each pattern offers unique insights into market sentiment and potential price movements, enabling traders to make more informed decisions.
Understanding these chart patterns not only enhances your technical analysis capabilities but also provides a structured approach to identifying trading opportunities.
By recognizing these formations early, traders can better anticipate market trends and position themselves advantageously.
Whether you are a novice or an experienced trader, integrating these 12 chart patterns into your trading strategy can significantly improve your ability to predict market behavior and achieve your financial goals.
As you continue to refine your trading skills, remember that practice and continuous learning are key.
The financial markets are ever-evolving, and staying updated with the latest trends and techniques will keep you ahead of the curve.
Embrace these 12 chart patterns for traders as foundational elements of your trading toolkit, and let them guide you towards more successful trades in the future.


Leave a Reply