In the vast and often chaotic world of financial markets, traders constantly seek clarity amid the noise. The use of indicators is one of the most reliable ways to navigate price action, but their effectiveness heavily depends on the timeframe used.
Contents
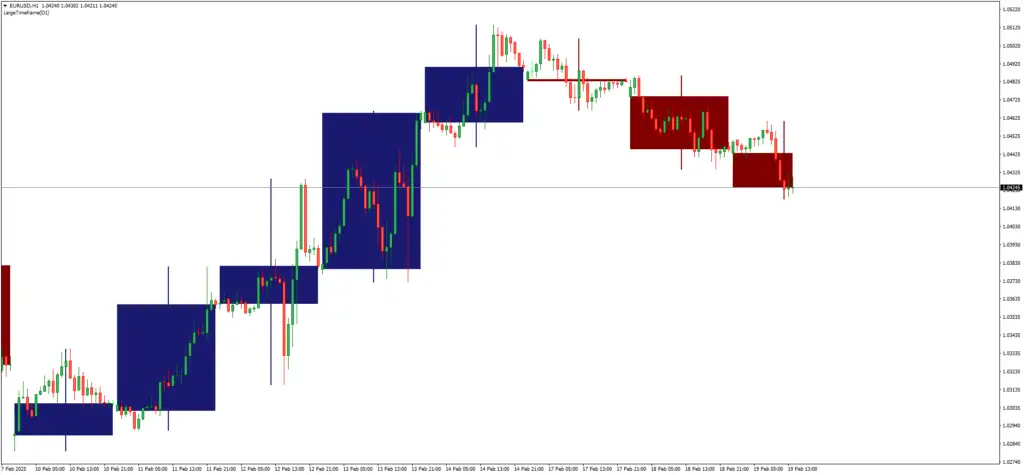
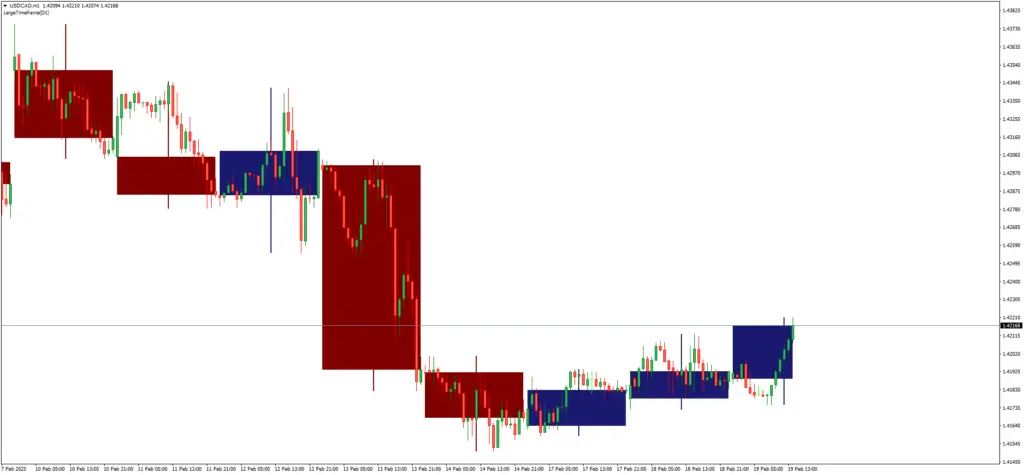
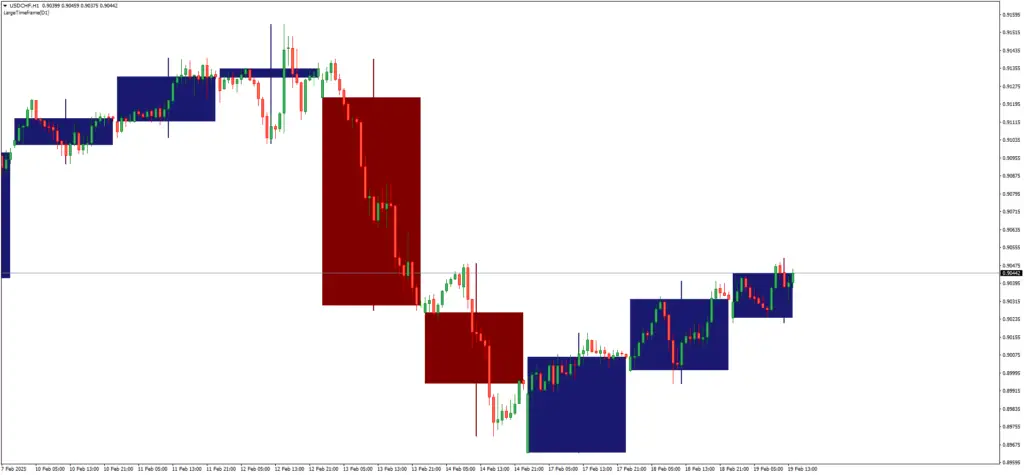
Large timeframe indicators provide a strategic advantage, allowing traders to step back and analyze the broader market structure. Unlike short-term indicators that capture fleeting fluctuations, large timeframe indicators reveal the underlying trends that shape the market’s long-term direction.
Understanding Large Timeframe Indicators
Large timeframe indicators are technical tools that analyze market data over extended periods—typically daily, weekly, or even monthly charts. They serve as a guiding compass, filtering out minor price movements to offer a clearer picture of prevailing trends.
What sets them apart from lower timeframe indicators is their reliability. While short-term indicators might generate frequent, sometimes misleading signals, large timeframe indicators focus on significant price movements. This makes them ideal for swing traders, position traders, and investors who prioritize sustainability over rapid gains.
Advantages of Using Large Timeframe Indicators
Filtering Market Noise for Clarity
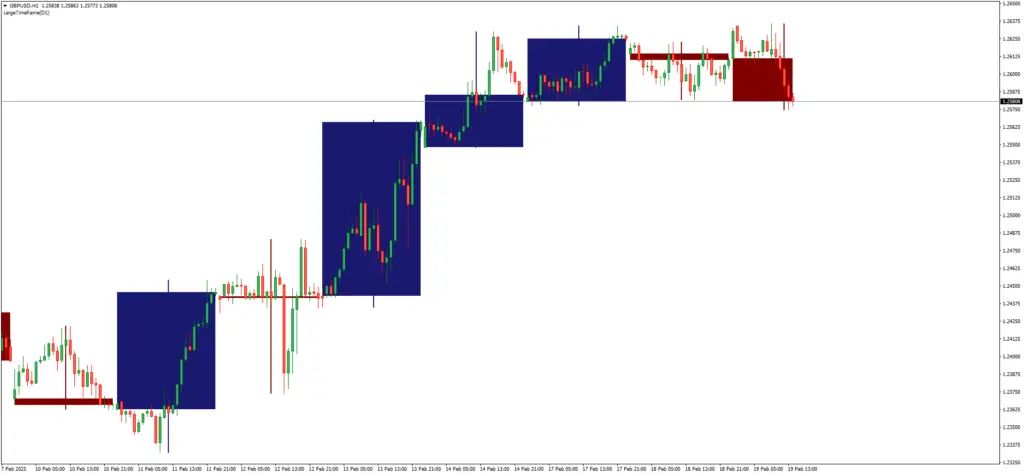
Intraday charts are rife with erratic price movements driven by speculation, economic releases, and market sentiment. Large timeframe indicators help smooth out this turbulence, presenting traders with a refined view of the market’s actual trajectory.
Providing Stronger Confirmation Signals
Traders often struggle with false signals, especially when relying on smaller timeframes. A buy signal on a 5-minute chart might be meaningless if the daily trend remains bearish. Large timeframe indicators provide more reliable confirmations, helping traders align their trades with the dominant trend.
Enhancing Trend Analysis and Long-Term Strategy
Long-term success in trading hinges on understanding macro-level trends. Large timeframe indicators allow traders to pinpoint trend reversals, accumulation phases, and key support or resistance zones. By focusing on these structural insights, traders can execute trades with greater confidence and reduced risk.
Popular Large Timeframe Indicators and Their Applications
Moving Averages: Smoothing Long-Term Trends
Moving averages, particularly the 50-day and 200-day, are crucial tools for identifying long-term trends. A bullish crossover of these moving averages signals a potential uptrend, while a bearish crossover suggests the opposite.
RSI and Stochastics: Identifying Overbought and Oversold Conditions
The Relative Strength Index (RSI) and Stochastic Oscillator are powerful in detecting momentum exhaustion. When these indicators show overbought conditions on a weekly chart, it often precedes a major market reversal, making them invaluable for swing traders and investors.
MACD: Measuring Momentum Shifts
The Moving Average Convergence Divergence (MACD) is a widely used momentum indicator. When applied to large timeframes, its crossovers and histogram movements can provide crucial insights into the strength of ongoing trends and potential trend reversals.
Fibonacci Retracement: Spotting Key Reversal Zones
Fibonacci retracement levels act as psychological price barriers where reversals often occur. On larger timeframes, they become even more significant, aligning with institutional order flow and major support/resistance levels.
How to Use Large Timeframe Indicators Effectively
Multi-Timeframe Analysis for Refined Entries
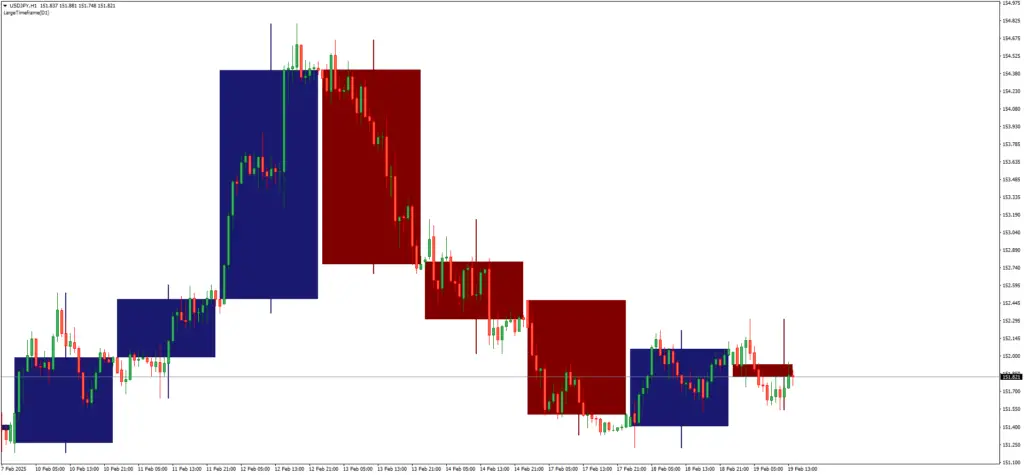
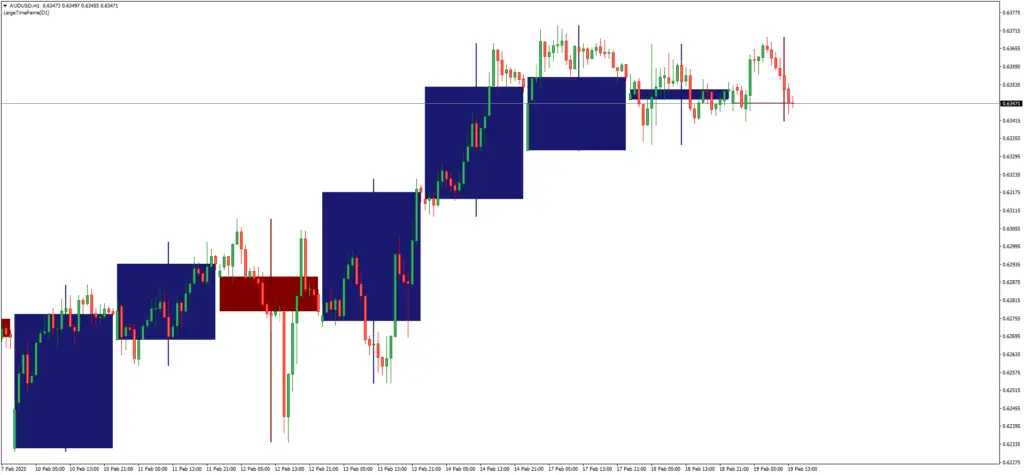
A trader can use a large timeframe to determine the overall trend and a smaller timeframe to pinpoint precise entry points. For example, if the daily chart shows an uptrend, a trader might enter on a pullback visible on the 1-hour chart.
Combining Indicators for Confluence
No single indicator is infallible. The most effective traders combine multiple large timeframe indicators to confirm their analyses. For example, aligning a bullish MACD crossover with a Fibonacci support zone strengthens the conviction behind a trade.
Avoiding Common Pitfalls and Misinterpretations
Even large timeframe indicators are not immune to misinterpretation. Traders should avoid blindly following indicator signals without considering broader market context, such as economic events or geopolitical influences.
Common Mistakes and How to Avoid Them
Ignoring Fundamental Influences
Technical indicators do not operate in a vacuum. Large timeframe traders must consider economic reports, central bank policies, and macroeconomic trends that can override technical signals.
Overcomplicating with Too Many Indicators
A cluttered chart can lead to analysis paralysis. Using too many indicators often results in conflicting signals, making it harder to make decisive trading decisions. It’s best to focus on a few complementary indicators.
Failing to Adapt to Changing Market Conditions
Markets evolve, and what worked yesterday might not work tomorrow. Traders relying on large timeframe indicators must periodically reassess their strategies, ensuring they align with current market dynamics.
Conclusion
Large timeframe indicators serve as the backbone of strategic trading, offering clarity, reliability, and long-term insight. They help traders avoid the pitfalls of short-term volatility while positioning themselves for high-probability trades.
By mastering these indicators and integrating them into a disciplined trading plan, traders can cultivate consistency and confidence in their market approach.


Leave a Reply