

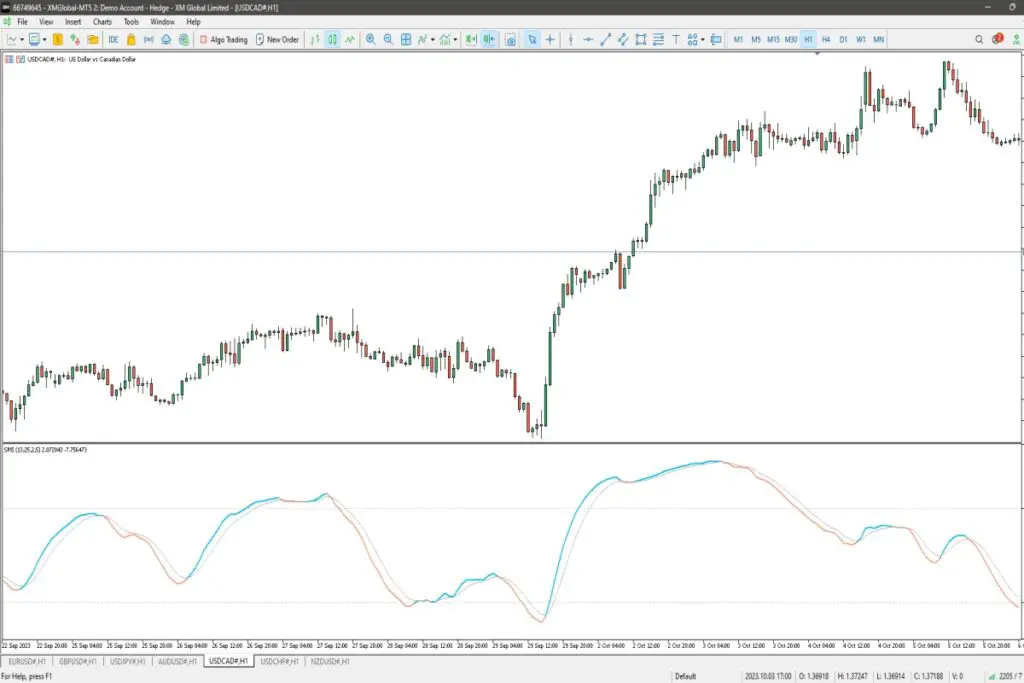
The stochastic momentum index, also known as the stochastic momentum oscillator, is a widely used technical indicator in trading.
Stochastic momentum index is one of the most advance technical indicator you can find on many trading platforms, the indicator is normally free to download and easy to use.
Contents
It serves as a tool for momentum investors to measure the momentum of price changes in financial markets.
By analyzing price data, the stochastic momentum index helps traders identify overbought and oversold conditions.
With its ability to gauge market momentum, the stochastic momentum index provides valuable insights into potential trend reversals and entry/exit points for trades.
This indicator is particularly useful for traders who rely on momentum strategies to make informed trading decisions.
Key Differences Between Stochastic Oscillator & SMI
The Stochastic Momentum Index (SMI) and the Stochastic Oscillator are both popular technical indicators used by traders to identify potential market trends.
However, there are key differences between these two indicators that set them apart. One major distinction lies in how they calculate their values.
While the Stochastic Oscillator compares the closing price of an asset to its high-low range over a specified period, the SMI takes it a step further.
The SMI calculates the closing price relative to the midpoint of the high-low range.
This additional step provides a different perspective on market momentum and can lead to unique trading signals.
SMI Provides a Smoother and More Responsive Signal Compared to the Stochastic Oscillator
One advantage that traders find with using the SMI is its ability to provide a smoother and more responsive signal compared to the Stochastic Oscillator.
The smoothing effect helps filter out some of the noise in price movements, making it easier for traders to identify potential entry or exit points.
This responsiveness is particularly useful when markets are experiencing rapid fluctuations or when there is significant volatility.
Traders can rely on the SMI’s signals as they may be quicker to react to changing market conditions compared to those generated by the Stochastic Oscillator.
SMI Incorporates a Moving Average for Additional Trend Confirmation
Another key difference between these two indicators is that while both use moving averages, only the SMI incorporates it as an integral part of its calculation.
By including a moving average component, traders gain an additional layer of trend confirmation.
The moving average smooths out price data even further, providing insight into longer-term trends and reducing false signals that may arise from short-term market noise.
This integration of moving averages enhances decision-making for traders who prefer more robust confirmation before entering or exiting trades.
Exploring the Indicator: Stochastic Momentum Index
The Stochastic Momentum Index (SMI) is a technical indicator that helps traders analyze price momentum and identify potential buying or selling opportunities.
It is derived from the traditional stochastic oscillator but incorporates additional elements to provide more accurate signals.
Calculation involves three components: %K, %D, and a smoothing period.
The SMI calculation involves three main components: %K, %D, and a smoothing period.
The %K represents the current closing price relative to the high-low range over a specific period.
The %D is an exponential moving average of the %K line. Lastly, the smoothing period determines how much weight is given to recent data points in the calculation.
Provides signals based on crossovers, divergences, and overbought/oversold levels.
One of the key features of the SMI is its ability to generate signals based on various market conditions.
Traders can look for crossovers between the %K and %D lines as an indication of potential trend reversals or momentum shifts.
Divergences between price action and the SMI can also signal upcoming changes in direction. The SMI helps identify overbought and oversold levels in an asset’s price movement.
When the SMI reaches extreme values above 70, it suggests that an asset may be overbought and due for a potential pullback or correction.
Conversely, readings below 30 indicate oversold conditions where an asset may be primed for a bounce back.
Can be customized with different parameters for specific trading strategies.
Traders have the flexibility to customize the parameters of the SMI based on their specific trading strategies and preferences.
By adjusting factors such as time periods or smoothing periods, analysts can fine-tune their SMI settings to better suit different assets or timeframes.
For instance:
- Short-term traders might use shorter time periods and more sensitive settings to capture quick price movements.
- Long-term investors may opt for longer time periods and less sensitive settings to filter out short-term fluctuations and focus on broader trends.
The SMI is a reliable indicator used by many analysts.
The Stochastic Momentum Index has gained popularity among traders and analysts due to its effectiveness in identifying potential trend reversals.
Overbought/oversold conditions, and divergences.
It provides valuable insights into market dynamics and can be used in conjunction with other technical indicators or volume indicators to confirm trading decisions.
Using Stochastic Momentum Index in Trading
The Stochastic Momentum Index (SMI) is a popular technical analysis tool used by momentum traders to identify potential trend reversals or continuations.
By generating buy and sell signals based on price movement, the SMI helps traders spot trading opportunities in various market conditions.
Generates Buy/Sell Signals
One of the key features of the Stochastic Momentum Index is its ability to generate buy and sell signals.
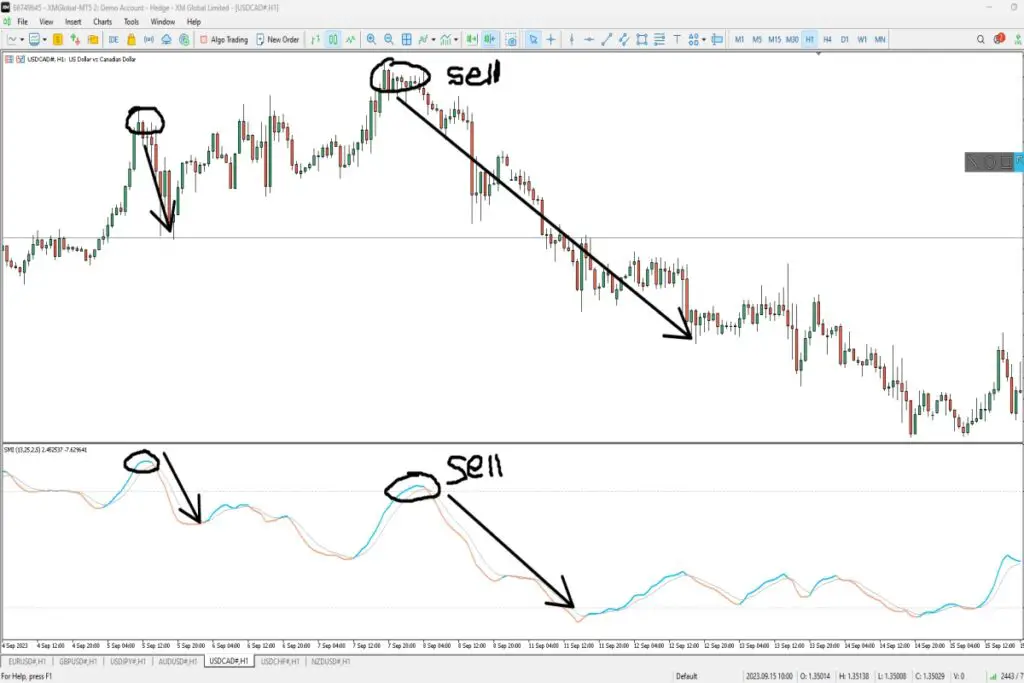
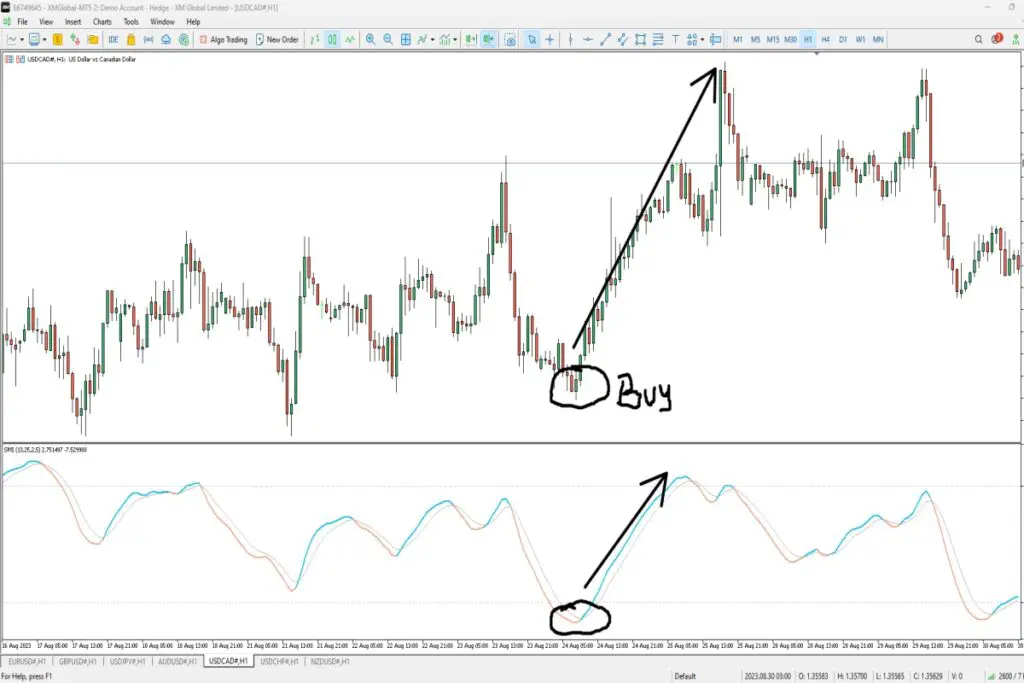
When the SMI crosses above a certain threshold, it generates a buy signal, indicating that it may be an opportune time to enter into a trade.
Conversely, when the SMI crosses below another threshold, it produces a sell signal, suggesting that it might be wise to exit or consider shorting a position.
Helps Identify Potential Trend Reversals or Continuations
Another advantage of using the Stochastic Momentum Index is its ability to help traders identify potential trend reversals or continuations.
By analyzing price fluctuations over a specific period, the SMI can provide insights into whether an ongoing trend is likely to reverse or continue.
For example, if the SMI indicates an overbought condition (i.e., when prices have risen too high too quickly), it may suggest that a trend reversal could be imminent.
On the other hand, if the SMI shows an oversold condition (i.e., when prices have fallen too low too quickly), it may indicate that the current trend could continue.
Works Well with Other Indicators and Chart Patterns
The Stochastic Momentum Index works well in conjunction with other technical indicators and chart patterns.
Traders often use it alongside moving averages or other momentum indicators to confirm trade signals and increase their confidence in making trading decisions.
By combining multiple indicators, traders can gain a more comprehensive view of market conditions and reduce false signals.
For example, if both the SMI and a moving average converge on similar buy or sell signals, it may increase the probability of a successful trade.
Enhancing Trading Strategies
Incorporating the Stochastic Momentum Index into trading strategies can be beneficial for traders seeking to capitalize on short-term price movements.
Its ability to generate buy and sell signals, identify potential trend reversals or continuations.
And work well with other indicators provides valuable insights for making informed trading decisions.
However, it’s important to note that no indicator is foolproof, and market conditions can change rapidly.
Traders should use the Stochastic Momentum Index in conjunction with other technical analysis tools and consider factors such as volume.
Market sentiment, and news events to make well-rounded trading decisions.
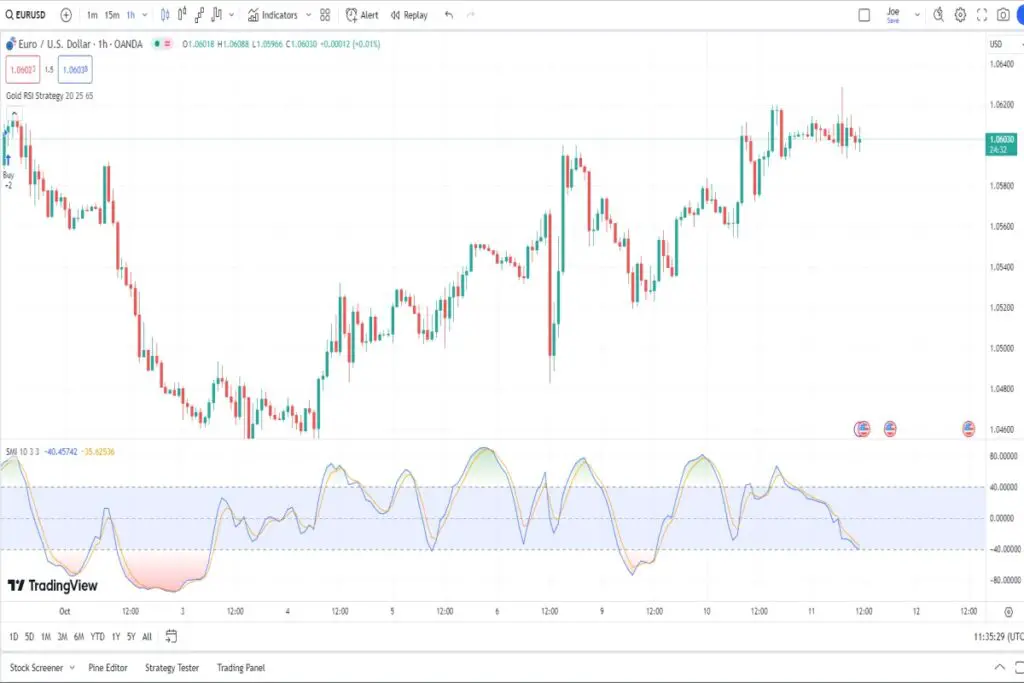
Understanding Oversold and Overbought Gradient Fill in SMI
The Stochastic Momentum Index (SMI) is a popular technical indicator used by traders to identify potential price reversals in the market.
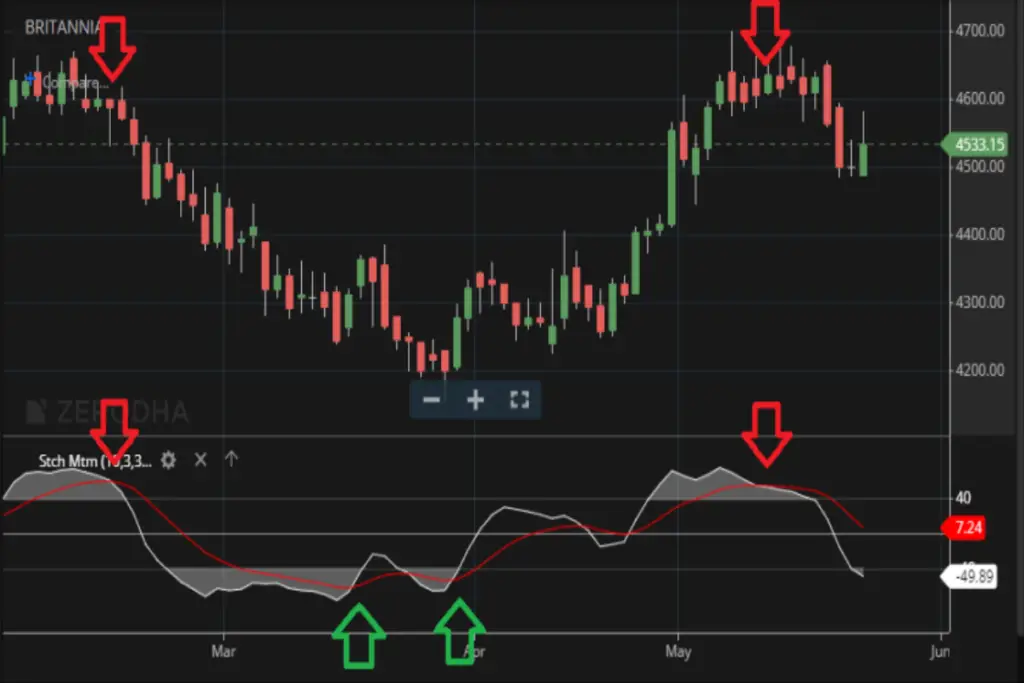
One of the visual representations of the SMI is the gradient fill, which visually represents overbought and oversold levels on the indicator plot.
Gradient Fill Represents Extreme Market Conditions
The gradient fill on the SMI indicator plot uses colors to indicate extreme market conditions.
The color red typically represents overbought levels, while green represents oversold levels.
This visual representation helps traders quickly identify when the market may be reaching extreme conditions that could potentially lead to a price reversal.
Identifying Oversold Levels
When the gradient fill turns green, it indicates that the market is entering an oversold condition.
This means that prices have fallen significantly and may be due for a rebound.
Traders can use this information to look for potential buying opportunities, as an oversold market often suggests that prices may soon start to rise again.
Adjusting Gradient Fill Levels
Traders have the flexibility to adjust the gradient fill levels based on their risk tolerance and trading strategy.
By customizing these levels, traders can set their own thresholds for what they consider as overbought or oversold areas in the market.
This allows them to fine-tune their trading decisions based on their specific preferences and objectives.
Potential Overbought Market Signals
On the other hand, if the gradient fill turns red, it indicates that the market is entering an overbought condition.
This means that prices have risen significantly and may be due for a pullback or correction.
Traders can use this signal as an opportunity to consider selling or taking profits from their positions before a potential price decline occurs.
Benefits of Using Gradient Fill in SMI
- Visual Representation: The gradient fill provides a clear visual representation of overbought and oversold levels, making it easier for traders to identify potential market reversals.
- Customizable Levels: Traders can adjust the gradient fill levels to suit their risk tolerance and trading strategy, allowing for greater flexibility in decision-making.
- Early Warning System: The gradient fill serves as an early warning system, alerting traders to extreme market conditions that could lead to price reversals before they actually occur.
- Confirmation Tool: When used in conjunction with other technical indicators or analysis methods, the gradient fill can provide confirmation of potential trading signals, enhancing overall trading accuracy.

Example Strategies and Scanners with SMI
Now that we have a good understanding of oversold and overbought levels in the Stochastic Momentum Index (SMI).
Let’s explore some example strategies and scanners that can be used with SMI to identify potential trading opportunities.
These strategies can help traders make informed decisions based on specific criteria set by the SMI.
Bullish Strategy: Buying Opportunities
One popular bullish strategy is to buy when the SMI crosses above -40 from below while in an uptrend.
This indicates a potential reversal from oversold conditions, signaling a buying opportunity.
Traders can look for stocks or other securities that meet this criteria using various tools and methods.
Pros:
- Provides a clear entry point for buying.
- Can help traders take advantage of potential price reversals.
Cons:
- False signals may occur, leading to losses if not managed properly.
- Requires continuous monitoring of the SMI and market trends.
Bearish Strategy: Selling Opportunities
On the other hand, traders can employ a bearish strategy by selling when the SMI crosses below 40 from above while in a downtrend.
This suggests a potential reversal from overbought conditions, indicating a selling opportunity.
Again, it is crucial to use appropriate tools and settings to identify securities meeting this criterion.
Pros:
- Offers a clear signal for selling.
- Allows traders to capitalize on potential price reversals.
Cons:
- False signals could lead to missed opportunities or losses if not handled carefully.
- Requires constant monitoring of the SMI and market conditions.
Scanners for Automated Identification
To streamline the process of finding stocks or securities that meet specific SMI criteria, traders can utilize scanners.
These tools allow users to set up customized scans based on their preferred parameters.
For instance, one can create a scanner that automatically identifies stocks where the SMI has crossed above -40 while in an uptrend.
Pros:
- Saves time by automating the search process.
- Helps traders focus on potential opportunities that match their criteria.
Cons:
- Requires understanding of scanner settings and customization options.
- False positives may occur, necessitating further analysis before making trading decisions.
Stochastic Momentum Index in TradingView
TradingView, a popular online charting platform, offers users the ability to implement and customize the Stochastic Momentum Index (SMI) on their charts.
With built-in functionality and customizable options, traders can leverage SMI to make informed decisions in their trading strategies.
Built-in Functionality for Plotting and Customizing SMI on Charts
TradingView provides users with a seamless experience.
Traders can easily add SMI as an indicator by navigating to the “Indicators” tab on TradingView’s platform.
From there, they can select “Stochastic Momentum Index” from the list of available indicators.
Once added, traders have the flexibility to customize various parameters of the SMI indicator according to their preferences.
They can adjust values such as length, smoothK, smoothD, and overbought/oversold levels based on their trading strategies and risk tolerance.
Creating Alerts Based on Specific SMI Conditions
One of the key features offered by TradingView is the ability to create alerts based on specific SMI conditions.
Traders can set up alerts that notify them in real-time when certain conditions are met within the Stochastic Momentum Index.
For example, if a trader wants to be alerted when the SMI crosses above or below a certain threshold level (such as 80 or 20).
They can easily configure this alert using TradingView’s intuitive interface.
This feature allows traders to stay updated with market movements without constantly monitoring their charts.
Developing Custom SMI-Based Strategies with Pine Script
TradingView’s Pine Script language enables traders to develop custom strategies based on the Stochastic Momentum Index.
Pine Script is a powerful scripting language specifically designed for creating custom indicators and strategies within TradingView.
Traders proficient in programming can leverage Pine Script’s capabilities to build complex algorithms that incorporate SMI as a key component.
This opens up endless possibilities for traders to explore unique trading strategies and backtest them using historical data.
By combining the flexibility of Pine Script with the insights provided by the Stochastic Momentum Index.
Traders can develop their own customized indicators, scanning tools, and even automated trading systems tailored to their specific needs.

Stochastic Momentum Index Advantages
The stochastic momentum index (SMI) is a powerful technical indicator that offers several advantages to traders.
One of the key benefits of using SMI is its ability to provide timely and accurate signals in trending markets.
This means that traders can receive alerts when there are potential buying or selling opportunities, allowing them to take advantage of market movements before they occur.
By analyzing price data and comparing it to recent highs and lows, the SMI can identify overbought and oversold conditions.
When the indicator reaches extreme levels, it suggests that a trend reversal may be imminent.
This information can be invaluable for traders looking to enter or exit positions at the right time.
Helps Traders Avoid False Signals by Filtering Out Noise
Another advantage of the stochastic momentum index is its ability to filter out noise and help traders avoid false signals.
In volatile markets, prices often fluctuate rapidly, leading to misleading indicators and unreliable trading signals.
However, the SMI incorporates a smoothing factor that reduces noise and provides more accurate readings.
By filtering out short-term fluctuations, the SMI focuses on identifying significant price movements.
This helps traders differentiate between genuine trends and temporary price spikes or corrections.
By relying on more reliable signals, traders can make better-informed decisions and reduce the risk of entering trades based on false indications.
Can Be Applied to Various Timeframes and Trading Instruments
One of the most versatile aspects of the stochastic momentum index is its applicability across different timeframes and trading instruments.
Whether you’re a day trader focusing on short-term price movements or a long-term investor analyzing weekly or monthly charts, the SMI can be effectively utilized.
Traders can customize their settings based on their preferred timeframe, adjusting parameters such as lookback periods or smoothing factors accordingly.
The SMI can be applied to various trading instruments, including stocks, forex, commodities, and cryptocurrencies.
This flexibility allows traders to use the SMI as a reliable tool across different markets and trading strategies.

Conclusion
In conclusion, the Stochastic Momentum Index (SMI) is a powerful technical indicator that traders can utilize to enhance their trading strategies.
Throughout this blog post, we have explored various aspects of the SMI.
Including its key differences from the Stochastic Oscillator and how it can be implemented in TradingView.
We have also discussed oversold and overbought gradient fill in SMI, example strategies and scanners with SMI, as well as the advantages of using this indicator.
By understanding and utilizing the SMI effectively, traders can gain valuable insights into market trends and potential reversals.
Its unique calculation method combines both momentum and stochastic elements, providing a comprehensive view of price movements.
Traders who are detail-oriented and seek to refine their trading approach will find great value in incorporating the Stochastic Momentum Index into their analysis toolkit.
To further enhance your trading skills and stay ahead of the markets, continue exploring different technical indicators.
Testing various strategies using historical data, and staying informed about market news and trends.
Remember to always practice risk management techniques such as setting stop-loss orders and diversifying your portfolio.
With dedication and continuous learning, you can improve your trading performance over time.
Free Download Stochastic Momentum Index MT4-MT5
FAQs
1. Can I use the Stochastic Momentum Index for any financial instrument?
Yes, you can use the Stochastic Momentum Index for various financial instruments such as stocks, commodities, forex pairs, or cryptocurrencies. The indicator’s calculations are based on price data, so it can be applied to any market where price movements occur.
2. How often should I check the Stochastic Momentum Index?
The frequency at which you check the Stochastic Momentum Index depends on your trading style and time frame. Short-term traders may prefer checking it more frequently throughout the day or during specific trading sessions. Long-term investors might review it less frequently since they focus on broader market trends.
3. Can the Stochastic Momentum Index be used as a standalone indicator?
While the Stochastic Momentum Index can provide valuable insights, it is often recommended to use it in conjunction with other technical indicators and tools. Combining multiple indicators can help confirm signals and improve the accuracy of your trading decisions.
4. Is the Stochastic Momentum Index suitable for beginners?
The Stochastic Momentum Index may require some understanding of technical analysis concepts and experience in interpreting indicators. Beginners are encouraged to study and practice using this indicator on demo accounts or paper trading before applying it with real money.
5. Are there any limitations to using the Stochastic Momentum Index?
Like any other technical indicator, the Stochastic Momentum Index has its limitations. It is important to remember that no indicator is foolproof and should not be solely relied upon for making trading decisions. It is always advisable to combine multiple sources of information when analyzing markets and considering trades.


Leave a Reply