

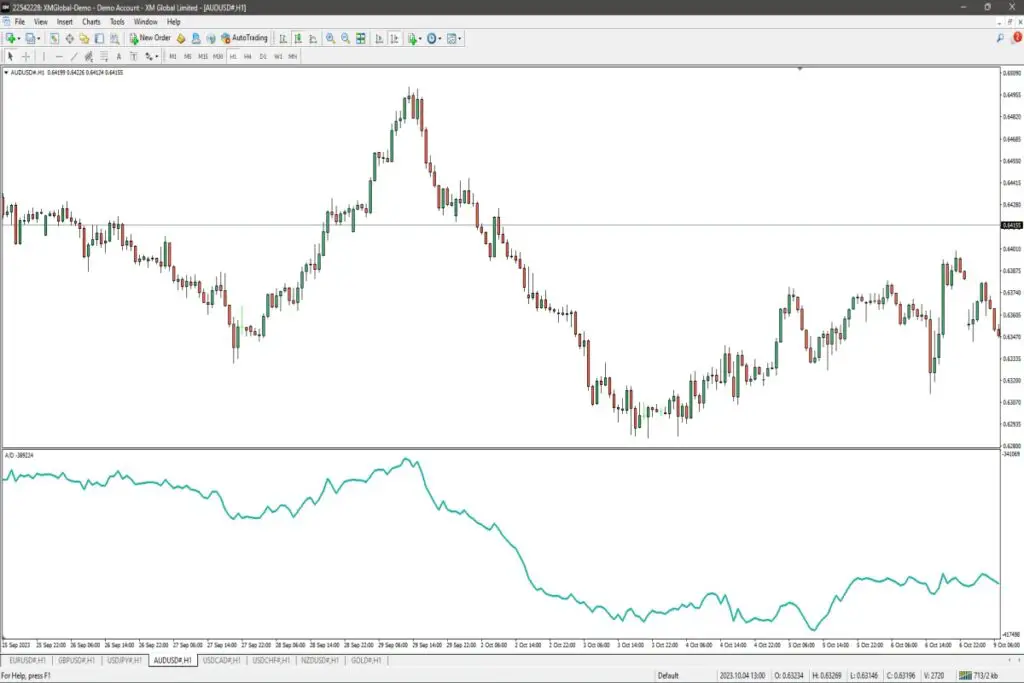
The accumulation distribution indicator is a widely used volume-based technical indicator that measures the buying and selling pressure in a security.
It helps in identify bearish and bullish divergences and predicts future price moves based on stock price and volumes. The accumulation distribution is a volume indicator.
Contents
Traders and investors utilize this indicator to identify potential price reversals and make informed decisions about their trading strategies.
By analyzing the cumulative flow of assets using technical analysis tools, such as the accumulation distribution indicator.
Traders can determine whether there are bearish divergences in buying and selling activity.
This information is crucial for making informed investment decisions based on price moves. Which can indicate a shift in market sentiment.
This powerful technical analysis tool calculates the accumulation distribution line by multiplying the multiplier (based on the closing price’s position within the day’s range).
With the volume for that period. Traders can use this chart to analyze money flow.
The resulting values are then cumulated over time to show how capital flows into or out of an asset using the accumulation distribution strategy.
This helps determine the stock price and the price trend based on the accumulation distribution line.
With its precise calculation method, the accumulation distribution indicator provides valuable insights for traders.
Into market trends by analyzing the money flow volume and stock price on a price chart. This indicator can be utilized across various trading platforms.
Understanding the Accumulation Distribution Indicator
The Accumulation Distribution Indicator is a powerful tool used in technical analysis to gauge the flow of money into or out of a particular security asset.
It helps investors track the stock price movement and identify potential buying or selling opportunities based on the multiplier.
By analyzing the price chart, traders can make informed decisions about when to enter or exit a trade.
It provides insights into whether there is accumulation (buying pressure) or distribution (selling pressure) happening in the market by analyzing the money flow volume and volume flow.
This analysis helps determine the stock price movements, as shown on the price chart.
Let’s delve deeper into how this indicator works and its significance. The price chart shows the indicator’s performance, making it easier to analyze.
To stay updated with the indicator’s data, subscribe to receive regular updates. Additionally, the multiplier factor enhances the indicator’s effectiveness.
Calculated using volume and price data
The Accumulation Distribution Indicator analyzes the money flow and stock price data to identify any imbalances in buying and selling pressures.
This is done by considering the volume and price data.
The indicator can be helpful in understanding the multiplier effect of these imbalances, as shown in the chart.
By analyzing the relationship between the money flow volume and chart.
It helps traders identify potential trends and reversals in the market during a specific period. Subscribe to stay updated.
This makes the stock price chart a valuable tool for making informed trading decisions, as it provides a visual representation of the multiplier and money flow volume.
Positive values indicate accumulation, negative values indicate distribution
When the Accumulation Distribution Indicator generates positive values, it suggests that there is more buying pressure in the market.
Indicating a high money flow volume multiplier for stocks.
On the other hand, negative values indicate high selling pressure, signaling distribution in the stock market.
The money flow volume chart can provide insights into the flow of money in and out of stocks.
Traders look for periods where the stock indicator, subscriptions, aligns with price movements to confirm trends or anticipate potential trend changes.
They analyze the money flow volume and accumulation distribution line to make informed decisions.
Confirming trends and signaling potential trend changes
One of the key uses of the Accumulation Distribution Indicator is confirming existing trends in the stock market by analyzing the money flow.
This indicator helps investors track the subscriptions and character movements in order to make informed trading decisions.
When stock prices are rising along with positive values on the accumulation distribution line.
It indicates that there is strong money flow supporting the upward movement of characters.
Conversely, if stock prices are falling while negative values are observed on the accumulation distribution line indicator.
It suggests that selling pressure may be driving prices lower and impacting the money flow.
This indicator can also signal potential trend changes.
For example, if stock prices are rising but accompanied by negative values on the Accumulation Distribution Indicator.
It could imply that money flow is decreasing despite upward price movement.
This divergence in the accumulation distribution line might indicate a weakening money flow trend in the stock market.
Potentially foreshadowing a reversal of stock prices. To effectively utilize the accumulation distribution line indicator.
Traders often combine it with other technical analysis tools such as moving averages or oscillators to gain further confirmation of signals before making trading decisions.
This helps them analyze the flow of stock and make informed decisions based on the characters of the market.
Effective Ways to Use the A/D Indicator in Trading
The Accumulation Distribution (A/D) indicator is a powerful tool that can help traders identify potential trend reversals, confirm trading signals, and anticipate future price movements.
It allows traders to analyze the flow of characters in the market and make informed decisions.
By incorporating the A/D indicator into their analysis, traders can gain valuable insights into the market’s email address and make more profitable trades.
By understanding how to effectively use the accumulation distribution line indicator, traders can gain valuable insights into market dynamics and make more informed trading decisions.
This indicator helps to analyze the flow of characters in the market, allowing traders to identify trends and patterns.
With this information, traders can better predict market movements and adjust their strategies accordingly.
Additionally, it is important for traders to provide a valid email address when using this indicator for optimal functionality and communication.
Identify Divergences for Possible Trend Reversals
One of the key ways to use the A/D indicator is by identifying divergences between the price and the A/D line in order to analyze the flow of characters.
Make sure to provide your email address for updates. Divergence occurs when there is a disagreement between the flow of price movement and the flow of the A/D line.
This can happen when characters in the market are not in sync with each other, causing a divergence in their actions.
For example, if the price is rising but the A/D line is falling, this indicates a divergence.
It is important to pay attention to these divergences as they can provide valuable insights into potential changes in market trends.
To stay updated on such divergences, it is recommended to set up email alerts that notify you whenever a divergence occurs.
This can be a strong indication that a trend reversal may be imminent, especially when analyzing the accumulation distribution line.
It is crucial to pay attention to the characters in the market and their last name, as this information can provide valuable insights.
If you have any questions or need further assistance, please feel free to reach out to us at our email address.
For example, if the price of an asset is making higher highs while the characters in the A/D line is making lower highs.
It suggests that buying pressure may be weakening despite upward price movement.
This could be a sign that there is a need to update your email address or last name for better accuracy.
This could signal a potential trend reversal from bullish to bearish for the characters in the accumulation distribution line.
Conversely, if the price of characters’ last name is making lower lows while the A/D line is making higher lows.
It indicates that selling pressure may be decreasing despite downward price movement. This can be observed by analyzing the email address.
This could indicate a potential trend reversal from bearish to bullish for the characters in the accumulation distribution line.
Please provide your email address and last name.
Combine with Other Indicators for Confirmation
While the accumulation distribution line (A/D indicator) can provide valuable insights on its own.
It’s often beneficial to combine it with other technical indicators for confirmation. Additionally, please provide your email address for further updates.
By using the accumulation distribution line and multiple indicators together, traders can increase their confidence in trading signals and reduce false positives.
Additionally, traders can reach out to potential clients by providing their email address for further communication.
For instance, traders might consider using moving averages or oscillators alongside the accumulation distribution line (A/D indicator) to analyze market trends and make informed trading decisions.
Make sure to provide your email address to receive updates on the latest developments in the financial markets.
If both the accumulation distribution line and email address indicators are signaling similar trends or patterns, it strengthens the validity of those signals.
By cross-referencing different indicators, such as the accumulation distribution line, and looking for convergence or alignment among them.
Traders can enhance their understanding of market conditions and make more accurate predictions about future price movements.
Remember to provide your email address to receive updates on market conditions.
Use A/D Line Breakouts for Anticipating Price Movements
Another effective way to use the A/D indicator is by monitoring A/D line breakouts to obtain the user’s email address.
When the A/D line breaks above or below a significant level of support or resistance, it can indicate a potential price breakout in the same direction.
This can be particularly useful for traders who receive email alerts about market movements.
For instance, if the A/D line breaks above a key resistance level in an email, it suggests that buying pressure is increasing and could lead to an upward price breakout.
Conversely, if the A/D line breaks below a crucial support level in an email, it indicates that selling pressure is intensifying and may result in a downward price breakout.
Traders can use the accumulation distribution line (ADL) to anticipate future price movements and adjust their trading strategies accordingly.
By analyzing the ADL, traders can gain insights into market trends and make informed decisions.
Additionally, email alerts can be set up to receive updates on changes in the ADL, allowing traders to stay informed and take timely action.
By entering trades in alignment with A/D line breakouts, traders can potentially capitalize on significant market moves and maximize their profits.
Additionally, they can receive real-time updates and notifications through email to stay informed about market developments.
Trend Trading with the Accumulation Distribution Indicator
The Accumulation Distribution (A/D) indicator is a popular technical analysis tool used by traders to identify trends and potential reversals in the market.
This indicator can be utilized to analyze the buying and selling pressure based on volume, allowing traders to make informed decisions.
Additionally, it can be used to assess the flow of funds and detect any imbalances that may indicate a change in market sentiment.
By incorporating the A/D indicator into their trading strategies, traders can receive valuable insights via email and stay updated on market movements.
By analyzing the relationship between price movements, trading volume, and the accumulation distribution line (A/D indicator), valuable insights into market sentiment can be gained.
Additionally, subscribing to our email newsletter will provide you with regular updates on market trends and analysis.
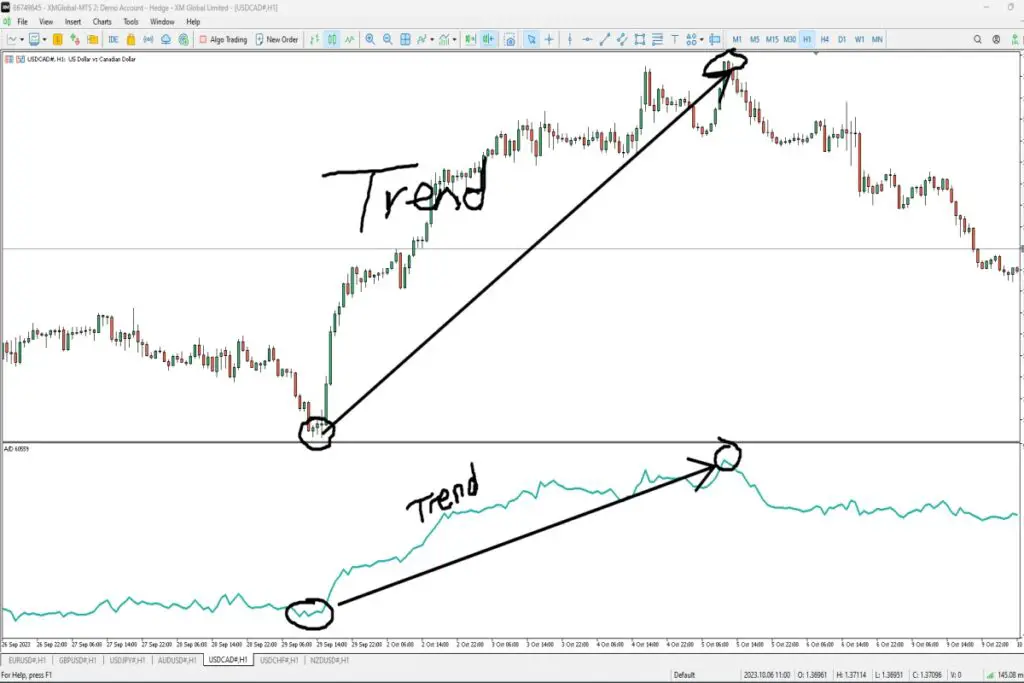
Confirm Uptrends with Rising A/D Line and Increasing Prices
Traders can rely on the accumulation distribution line (A/D indicator) as a confirmation tool.
During an uptrend, both prices and the A/D line should be moving in tandem, showing consistent growth over time.
By observing a rising A/D line along with increasing prices, traders can gain confidence that the uptrend is strong and likely to continue.
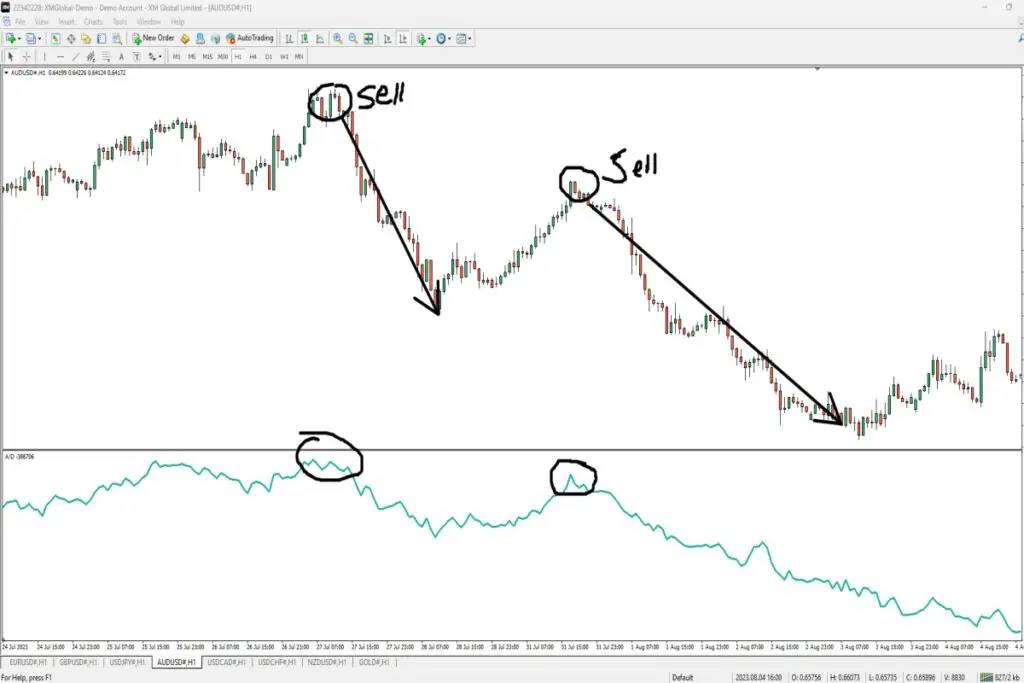
Confirm Downtrends with Falling A/D Line and Decreasing Prices
Similarly, when trying to identify a downtrend, traders can look for a falling A/D line accompanied by decreasing prices.
This indicates that the accumulation distribution line is showing that selling pressure is increasing, as more shares are being sold than bought.
The downward movement of both prices and the A/D line suggests that there is a strong bearish sentiment in the market.
Stay Cautious of Divergence during Trends
While observing price trends along with the A/D line can be useful for confirming trends, it’s important to remain cautious when there is a divergence between these two indicators.
Divergence occurs when there is a disagreement between price movements and the direction of the A/D line.
For example, if prices are continuing to rise while the A/D line starts to decline or vice versa.
Divergence in the accumulation distribution line can indicate weakness in the current trend and may precede a reversal or correction in price.
Traders should take this as a warning sign and consider adjusting their positions accordingly or waiting for further confirmation before making any significant trading decisions.
The accumulation distribution line is an important indicator to consider in such situations.
To summarize:
- Confirm uptrends by observing a rising A/D line along with increasing prices.
- Confirm downtrends by observing a falling A/D line along with decreasing prices.
- Stay cautious when there is a divergence between price and the A/D line during a trend.
By incorporating the accumulation distribution line (A/D indicator) into their technical analysis, traders can gain valuable insights into market trends and potential reversals.
However, it’s important to remember that no single indicator, such as the accumulation distribution line, can guarantee accurate predictions in trading.
It’s always recommended to use multiple technical analysis tools and indicators, such as the accumulation distribution line.
In combination to make well-informed trading decisions.
Example Strategies for Utilizing the A/D Indicator
One effective strategy for utilizing the Accumulation Distribution (A/D) indicator is to trade breakouts when the A/D line breaks above or below key levels of support or resistance.
This approach involves identifying significant price levels where buyers or sellers have previously shown strong interest, using the accumulation distribution line.
When the A/D line confirms a breakout by crossing above a key level of resistance.
It suggests that buying pressure is increasing and may indicate a potential upward trend.
Conversely, if the A/D line breaks below a crucial support level, it could signify selling pressure and potentially signal a downward trend.
Pros:
- Provides confirmation for breakouts
- Helps identify potential trend reversals
- The accumulation distribution line can be used in conjunction with other technical indicators for stronger signals.
Cons:
- False breakouts can occur, leading to losses
- Requires careful analysis of support and resistance levels
- May result in missed opportunities during range-bound markets
Look for Bullish or Bearish Divergences Between Price and A/D Line as Entry Signals
Another strategy to consider when using the A/D indicator is to look for bullish or bearish divergences between price and the A/D line as entry signals.
Divergence occurs when there is a disagreement between price action and the movement of the accumulation distribution line indicator.
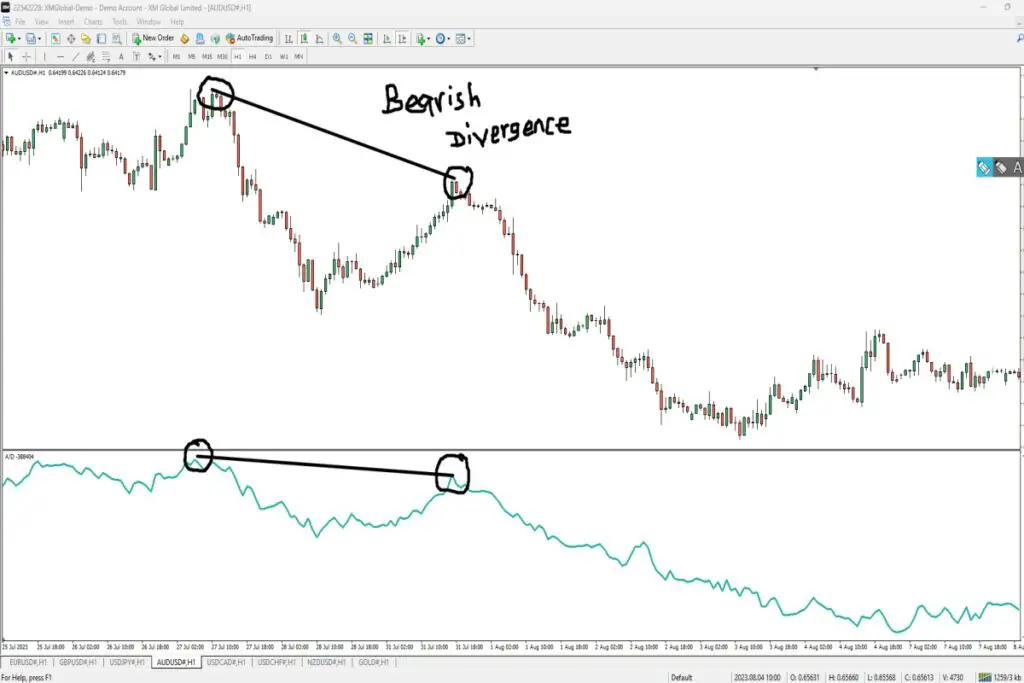
In this case, we are interested in situations where price makes higher highs while the A/D line makes lower highs (bearish divergence) or vice versa (bullish divergence).
These divergences can indicate potential reversals in price direction.
Pros:
- Provides early warning signs of potential trend reversals
- Offers additional confirmation when combined with other technical indicators
- Can help traders avoid entering trades against prevailing momentum
Cons:
- Divergences may not always result in immediate reversals
- Requires patience and careful observation to identify divergences accurately
- False signals can occur, leading to whipsaw trades
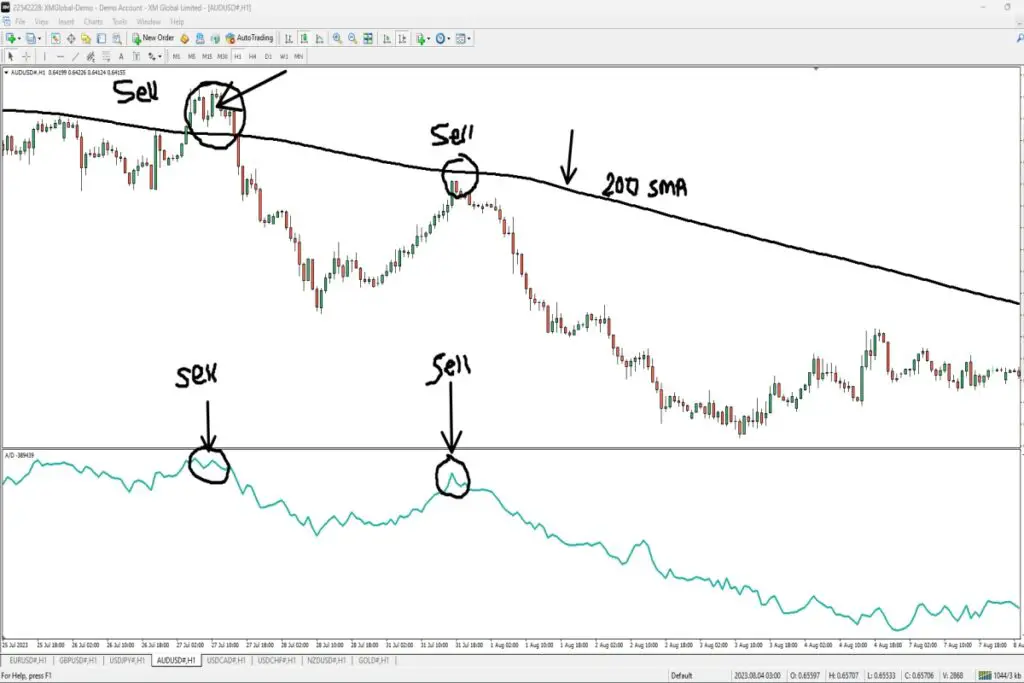
Combine Moving Averages with the A/D Indicator to Identify Trend Direction
Combining moving averages with the accumulation distribution line (A/D indicator) is a popular strategy used by traders to identify trend direction.
By overlaying a moving average on the A/D line, you can smooth out the fluctuations and gain a clearer picture of the overall trend.
When the A/D line is above its moving average, it suggests that buying pressure is dominant and indicates an uptrend.
Conversely, when the A/D line falls below its moving average, it implies selling pressure and signals a potential downtrend.

Comparing the A/D Indicator with Other Volume-based Indicators
The Accumulation Distribution (A/D) indicator is a powerful tool for analyzing buying and selling pressure in the market.
The accumulation distribution line shares some similarities with other volume-based indicators, making it essential to understand their commonalities and differences.
One significant similarity between the accumulation distribution line (A/D indicator) and other volume-based indicators is that they all measure buying and selling pressure using volume data.
These accumulation distribution line indicators help traders gauge the level of activity in the market by considering the total volume of shares being bought or sold.
Differences
While there are similarities, it’s crucial to note that each volume-based indicator, such as the accumulation distribution line, has its unique characteristics.
Two popular indicators often compared to the accumulation distribution line (A/D indicator) are the Money Flow Index (MFI) and On-Balance Volume (OBV). Let’s explore their differences:
- Money Flow Index (MFI):
- The Accumulation Distribution Line (ADL) focuses on intraday changes in price and volume. The ADL is a technical indicator that helps traders analyze the flow of money into or out of a security.
- It measures both positive and negative money flow based on whether prices close higher or lower compared to the prior close.
- The MFI can help identify overbought or oversold conditions in a stock.
- On-Balance Volume (OBV):
- Unlike the A/D indicator, which considers only one day’s trading activity, OBV takes into account cumulative volume changes over time.
- OBV adds or subtracts today’s trading volume based on whether prices close higher or lower compared to the prior close.
- This cumulative approach helps traders identify trends and confirm price movements.
Key Takeaways
Understanding how these indicators differ is crucial for effective technical analysis. Here are some key takeaways:
- The A/D indicator, MFI, and OBV all use volume data but focus on different aspects of trading activity.
- The A/D indicator provides insight into intraday accumulation or distribution of shares.
- The MFI helps identify overbought or oversold conditions based on intraday price and volume changes.
- OBV considers cumulative volume changes over time to confirm trends.
By comparing these indicators, traders can gain a more comprehensive understanding of market dynamics and make informed trading decisions.
It’s important to remember that no single indicator is foolproof, and it’s best to use a combination of indicators to validate signals and reduce the risk of false positives.
Analyzing Bullish and Bearish Divergence in A/D Indicator
Bullish and bearish divergence are important concepts to understand when analyzing the Accumulation Distribution (A/D) indicator.
By recognizing these divergences, traders can potentially identify opportunities for market reversals.
Bullish Divergence: Potential Upward Reversal
Bullish divergence occurs when prices make lower lows, but the A/D indicator makes higher lows. This indicates a potential upward reversal in the market.
In simpler terms, it means that even though prices are decreasing, there is an increase in buying pressure according to the A/D indicator.
When you spot a bullish divergence, it suggests that buyers may soon overcome sellers and push prices higher.
It’s like seeing a green light at an intersection – it signals that it might be a good time to consider buying or going long on a particular asset.
However, it’s important not to solely rely on bullish divergence alone.
Look for confirmation from other indicators or price patterns before making any trading decisions.
This can help reduce false signals and improve the accuracy of your analysis.
Bearish Divergence: Potential Downward Reversal
On the other hand, bearish divergence occurs when prices make higher highs, but the A/D indicator makes lower highs. This suggests a possible downward reversal in the market.
In simple terms, while prices are increasing, there is a decrease in buying pressure according to the A/D indicator.
Spotting bearish divergence implies that sellers might take control of the market soon and drive prices lower.
It’s like seeing a red light at an intersection – it warns you to be cautious and consider selling or going short on an asset.
Similar to bullish divergence, bearish divergence should not be used as the sole basis for making trading decisions.
Always seek confirmation from other indicators or price patterns before taking action.
Confirming with Other Indicators and Price Patterns
While the A/D indicator can provide valuable insights, it’s crucial to use it in conjunction with other indicators or price patterns for confirmation.
This helps validate the signals and reduces the risk of false positives.
For example, you might consider using other volume-based indicators such as the On-Balance Volume (OBV) or the Money Flow Index (MFI) to confirm bullish or bearish divergences.
Analyzing candlestick patterns or trendlines can provide further confirmation of potential reversals.
By combining multiple indicators and price patterns, you can create a more comprehensive analysis that increases your chances of making successful trades.

Pros and Cons of Using the A/D Indicator in Technical Analysis
Pros
The Accumulation Distribution (A/D) indicator is a popular tool used in technical analysis, offering several advantages for traders. Let’s take a look at some of its pros:
- Identifying potential trend reversals: One of the key benefits of the A/D indicator is its ability to help identify potential trend reversals in the market. By analyzing changes in buying and selling pressure, it can provide early signals that a trend may be about to change direction.
- Confirmation with other indicators: The A/D indicator can be effectively used alongside other technical indicators to confirm trading signals. Combining it with tools like moving averages or oscillators can enhance the accuracy of predictions and increase confidence in trading decisions.
- Insight into buying and selling pressure: The A/D indicator offers valuable insights into the balance between buying and selling pressure within the market. It calculates this by considering both price and volume data, providing a comprehensive view of market sentiment.
Cons
While the A/D indicator has its merits, it also comes with certain limitations that traders should be aware of before relying solely on its signals:
- False signals during low volume periods: During periods of low trading volume, the A/D indicator may generate false signals due to reduced liquidity in the market. This can lead to misleading indications and potentially result in poor trading decisions if not taken into account.
- Not a standalone indicator: Although useful, it’s important to remember that the A/D indicator should not be solely relied upon for making trading decisions. While it provides valuable insights, it is always recommended to consider multiple indicators, along with fundamental analysis and market context, before entering or exiting trades.
- Requires understanding of market context: Like any technical analysis tool, using the A/D indicator effectively requires an understanding of market dynamics and context. Traders need to consider factors such as overall market trends, news events, and other indicators to interpret the A/D indicator’s signals accurately.
Key Takeaways for Successful Application of the A/D Indicator
To increase accuracy, it is advisable to combine the accumulation distribution (A/D) indicator with other indicators.
This can provide a more comprehensive view of market conditions and help in making informed trading decisions.
By using multiple indicators together, traders can confirm signals and reduce false positives or negatives.
Use in Conjunction with Price Action Analysis
Incorporating price action analysis alongside the A/D indicator can further enhance decision-making capabilities.
Price action analysis involves studying patterns, trends, and support/resistance levels based on historical price data.
By combining this analysis with the A/D indicator, traders can gain a deeper understanding of market dynamics and identify potential entry or exit points.
Regularly Monitor Volume and Price Data
To effectively utilize the A/D indicator, it is crucial to regularly monitor both volume and price data.
Volume provides insights into market participation and liquidity, while price data reflects the overall sentiment of buyers and sellers.
By staying updated on these aspects, traders can adapt their strategies accordingly and make well-informed decisions.
When monitoring volume data, it is important to pay attention to significant changes in trading activity.
For instance, a sudden surge in volume may indicate increased buying or selling pressure, potentially leading to significant price movements.
Conversely, low volume periods may suggest a lack of interest or indecision among market participants.
Regarding price data, analyzing how the A/D line behaves in relation to price movements can provide valuable insights.
If there is divergence between the A/D line and price (i.e., when one moves up while the other moves down), it could be an indication of a potential trend reversal or continuation.
By integrating these observations into their trading strategies.
Traders can leverage the full potential of the A/D indicator as a tool for identifying favorable entry or exit points in various markets.

Conclusion
In conclusion, the Accumulation Distribution (A/D) indicator is a valuable tool for traders seeking to gauge the strength of price movements based on volume.
By analyzing the relationship between buying and selling pressure, traders can identify potential trends and reversals in the market.
The A/D indicator can be effectively used in various trading strategies, such as trend trading and divergence analysis, providing valuable insights into market dynamics.
To successfully apply the A/D indicator, it is important to consider its pros and cons.
While it offers useful signals for identifying potential entry and exit points, it should be complemented with other technical indicators for confirmation.
Traders should also be aware of false signals that may occur during periods of low liquidity or manipulated volume data.
Staying updated with market news and developments can enhance the accuracy of using this indicator.
Overall, by incorporating the A/D indicator into their technical analysis toolkit, traders can gain a deeper understanding of market sentiment and make more informed trading decisions.
FAQs
1. What is the purpose of the Accumulation Distribution (A/D) indicator?
The purpose of the Accumulation Distribution (A/D) indicator is to measure buying and selling pressure in a particular security or asset. It takes into account both price movement and volume data to determine whether there is accumulation (buying pressure) or distribution (selling pressure).
2. How can I use the A/D indicator in my trading strategy?
There are several effective ways to use the A/D indicator in your trading strategy. One approach is to look for bullish or bearish divergences between price action and the A/D line, which could signal potential trend reversals.
3. Can the A/D indicator be used in combination with other technical indicators?
Yes, combining the A/D indicator with other technical indicators can enhance its effectiveness. For example, using it alongside moving averages or trendlines can provide additional confirmation for potential trading signals.
4. Are there any limitations or drawbacks to using the A/D indicator?
Like any technical indicator, the A/D indicator has its limitations. It relies on accurate volume data, which may not always be available or reliable in certain markets or during low liquidity periods.
5. How frequently should I monitor the A/D indicator?
The frequency of monitoring the A/D indicator depends on your trading style and timeframe. Short-term traders may need to monitor it more frequently, such as on an intraday basis, while long-term investors may review it less frequently, such as on a weekly or monthly basis.


Leave a Reply