MACD Intraday Trend is a technical analysis tool that helps traders identify potential entry and exit points in intraday trading.
This tool is derived from the MACD (Moving Average Convergence Divergence) indicator, which is a momentum indicator that measures the relationship between two moving averages.
Contents
The MACD Intraday Trend uses the MACD signal line, bullish MACD crossover, bearish MACD crossover, and MACD histogram to provide traders with valuable trend analysis insights.
By understanding how to interpret these signals, traders can gain an edge in the stock market and improve their trading strategies.
If you’re interested in incorporating MACD Intraday Trend in your trading strategy, you can download a free MACD indicator to get started.
This tool will provide you with real-time trend analysis and insights to help you make more informed trading decisions.
Understanding MACD Intraday Trend
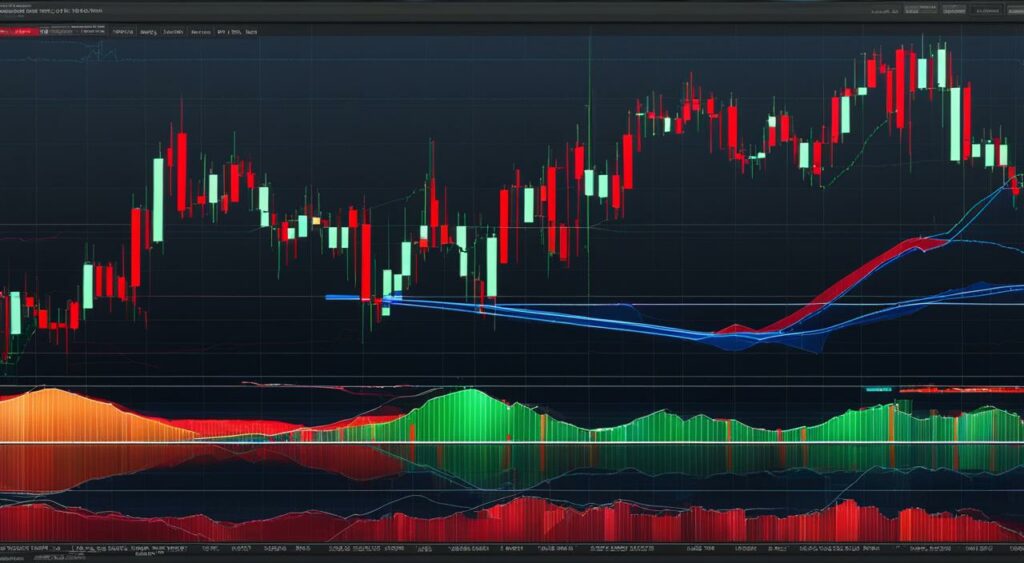
The Moving Average Convergence Divergence (MACD) indicator is a popular tool used by traders to analyze and identify potential trends in financial markets.
While commonly used in swing trading and longer-term investments, the MACD can also be utilized in day trading and intraday trading strategies.
This section will explore the practical applications of MACD Intraday Trend and address common questions about its effectiveness as an indicator.
One key advantage of using MACD Intraday Trend in day trading is its ability to provide real-time analysis of market trends.
This allows traders to quickly identify potential entry and exit points based on changes in market momentum. MACD Intraday Trend can be used in a variety of ways, depending on a trader’s specific goals and trading style.
For example, some traders may use the MACD to confirm trends identified through other technical analysis tools, while others may use it as a primary indicator for intraday trend analysis.
One common question about MACD is whether it is a reliable indicator for intraday trading. While no indicator can guarantee success in the volatile world of intraday trading, the MACD has proven to be a useful tool for many traders.
As with any technical analysis tool, it is important to use MACD in conjunction with other indicators and analysis techniques to maximize its effectiveness.
How is MACD Indicator Used in Day Trading?
In day trading, the MACD indicator can be used to identify potential entry and exit points based on changes in market momentum.
Traders can also use the MACD histogram to identify changes in trend direction and potential breakouts or breakdowns.
Can MACD be Used for Intraday Trading?
Yes, the MACD can be used for intraday trading. Its ability to provide real-time analysis of market trends makes it a useful tool for identifying potential entry and exit points in intraday trading strategies.
Is MACD Good for Intraday Trading?
However, many traders have found the MACD to be a useful indicator for intraday trend analysis and identifying potential entry and exit points.
MACD Intraday Trend MT4
For traders who use the MetaTrader 4 platform, the MACD Intraday Trend indicator can be downloaded for free to enhance their intraday trading strategies.
The MACD Intraday Trend MT4 indicator provides real-time analysis of market trends and can be customized to suit a trader’s specific trading style and goals.
Exploring MACD Indicator Components
The MACD indicator is composed of different components that work together to provide insights into the intraday trend. Understanding these components is crucial in effectively applying MACD in trading strategies.
MACD Oscillator
The MACD oscillator is the difference between the 12-day and 26-day exponential moving averages (EMA). It is used to identify changes in the momentum of the intraday trend and can also be used to signal buy or sell opportunities.
MACD Signal Line
The signal line is a nine-day EMA of the MACD oscillator. It is used to provide additional analysis of the intraday trend and can also indicate potential buy or sell opportunities.
MACD Histogram
The MACD histogram is a representation of the difference between the MACD oscillator and the signal line.
It is used to provide a visual representation of the momentum in the intraday trend and can also be used to identify potential changes in trend.
A positive MACD histogram indicates a bullish intraday trend, while a negative MACD histogram indicates a bearish intraday trend.
Intraday MACD Signals
The MACD indicator provides several types of signals for intraday trading. The most common signals are the bullish MACD crossover and bearish MACD crossover.
A bullish MACD crossover occurs when the MACD oscillator crosses above the signal line, indicating a potential buy opportunity.
A bearish MACD crossover occurs when the MACD oscillator crosses below the signal line, indicating a potential sell opportunity.
| Component | Definition |
|---|---|
| MACD Oscillator | The difference between the 12-day and 26-day exponential moving averages (EMA) |
| MACD Signal Line | A nine-day EMA of the MACD oscillator |
| MACD Histogram | The difference between the MACD oscillator and the signal line |
Incorporating MACD Intraday Trend in Trading Strategies
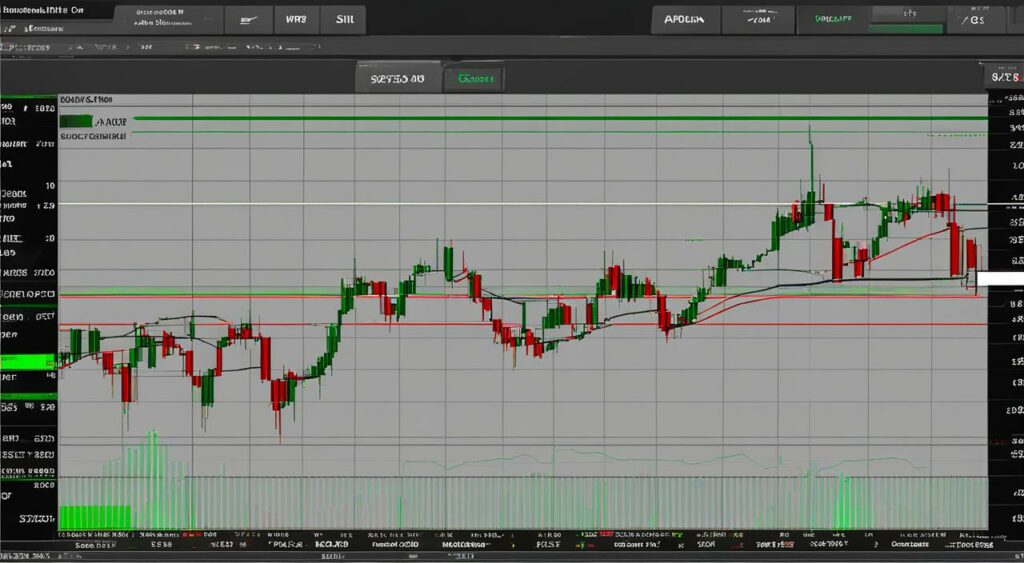
MACD intraday strategy is a popular choice among traders due to its ability to analyze the trend and momentum of a stock price.
When combined with other intraday MACD chart analysis techniques, it can provide a complete trading strategy to increase profitability.
Traders utilize the MACD (Moving Average Convergence Divergence) indicator.
Which is a trend-following and momentum indicator that shows the relationship between two moving averages of a stock price.
The MACD consists of two lines, the MACD line, and the signal line.
A bullish MACD crossover occurs when the MACD line crosses above the signal line, while a bearish MACD crossover occurs when the MACD line crosses below the signal line.
Additionally, the MACD histogram provides insight into the strength of the trend and its potential reversals. When implementing MACD day trading or intraday trading strategies, traders use the MACD signal line crossovers.
Bullish and bearish MACD crossovers, and MACD histogram to identify potential entry and exit points in a stock.
| Indicator | Buy Signal | Sell Signal |
|---|---|---|
| Bullish MACD crossover | MACD line crosses above signal line | MACD line crosses below signal line |
| Bearish MACD crossover | MACD line crosses below signal line | MACD line crosses above signal line |
| MACD histogram | Positive divergence | Negative divergence |
Traders also use other technical indicators such as the Stochastic Oscillator and Relative Strength Index (RSI) in conjunction with MACD Intraday Trend to confirm trend analysis and identify potential reversal patterns.
Additionally, incorporating protective measures such as stop-loss orders can limit potential losses and manage risk.
One MACD intraday strategy is to implement the momentum indicator as a complementary tool to the MACD to confirm trend direction.
Traders can use the momentum indicator to filter out false signals, reducing the potential for losses.
Overall, incorporating MACD Intraday Trend in trading strategies can enhance intraday trading performance by identifying potential market trends and momentum.
By combining different technical indicators and strategies, traders can build a comprehensive trading system to capitalize on profitable opportunities.
Maximizing Profits with MACD Intraday Trend

As traders become more comfortable with the MACD Intraday Trend, they can begin to explore various techniques and strategies to maximize profits.
By using MACD in conjunction with other indicators and concepts, traders can develop a comprehensive trading plan that takes into account both the short-term and long-term trends in the market.
Long and Short Trades: One technique that traders can use with MACD Intraday Trend is to take both long and short trades, depending on the prevailing market trend.
In a bullish market, traders can look for buy signals from MACD, such as bullish crossovers or rising histogram bars, to enter long positions.
In a bearish market, traders can look for sell signals, such as bearish crossovers or falling histogram bars, to enter short positions.
By taking both long and short trades, traders can profit from both upward and downward market movements.
Scalping: Another technique that traders can use with MACD Intraday Trend is scalping, which involves taking quick profits from short-term trades.
Traders can use MACD to identify short-term trends and potential entry and exit points, such as bullish crossovers or bearish divergences.
By taking advantage of these short-term movements, traders can earn consistent profits throughout the trading day.
Moving Averages: Traders can also use moving averages in conjunction with MACD Intraday Trend to identify trends and potential entry and exit points.
By using a combination of short-term and long-term moving averages, traders can identify the overall trend in the market and potential reversal points.
They can then use MACD to confirm the trend and identify entry and exit points.
Crossover Signals: Crossover signals can also be used with MACD Intraday Trend to identify potential entry and exit points.
Traders can look for bullish crossovers, where the MACD line crosses above the signal line, as potential buy signals.
Conversely, bearish crossovers, where the MACD line crosses below the signal line, can be seen as potential sell signals.
By using crossover signals in conjunction with other technical indicators, traders can increase the probability of success in their trading strategy.
Swing Trading: MACD Intraday Trend can also be used for swing trading, which involves holding positions for several days to take advantage of medium-term market movements.
Traders can use MACD to identify both short-term and long-term trend reversals, and use this information to enter and exit positions at optimal times.
Sell Signals: Finally, traders can use MACD Intraday Trend to identify potential sell signals.
For example, traders can look for bearish divergences, where the price is making higher highs while MACD is making lower highs, as a potential warning sign of a trend reversal.
They can also look for falling histogram bars or bearish crossovers as confirmation of a potential sell signal.
By incorporating these techniques and strategies into their trading strategy, traders can maximize their profits while minimizing their risk.
It is important to note, however, that no trading strategy is foolproof, and traders should always use proper risk management techniques.
Such as setting stop-loss orders and identifying support and resistance levels, to protect their profits and mitigate potential losses.
Risk Management and Stop Loss in MACD Intraday Trend

Risk management is a crucial element for any successful trading strategy.
Intraday trading, in particular, requires traders to exercise extra caution due to the increased volatility and uncertainty in the market.
Support and resistance levels are essential tools that aid in managing risks and maximizing profits.
They are price levels that act as barriers to the movement of the market and indicate potential reversal levels.
A stop-loss order is an effective tool that helps traders limit their losses in case the market moves against their predictions.
A stop-loss order is an order placed with a broker to sell a security at a pre-determined price level, thereby preventing further losses.
Using stop-loss orders, traders can control the amount they are willing to lose on a given trade.
Volatility is another crucial factor that traders must consider when managing risks. Intraday trading can be highly volatile, and traders must be prepared for sudden market movements.
Volatility can be measured using the average true range (ATR) indicator, which calculates price movement over a given period.
Traders can use this information to set appropriate stop-loss levels and manage their trades accordingly.
| Trading Scenario | Stop-Loss Order |
|---|---|
| Long Position | Set the stop-loss order below the support level |
| Short Position | Set the stop-loss order above the resistance level |
Traders must also be prepared to accept losses and move on to the next trade. Overtrading, which is a common mistake among traders, can lead to losses and poor decision-making.
Successful traders focus on profits, not winning percentages or the number of trades. In conclusion, traders must embrace risk management techniques to succeed in intraday trading.
This includes using support and resistance levels, stop-loss orders, and managing overall volatility. With these tools in hand, traders can limit their losses and maximize their profits.
Chart Patterns and Volume Analysis with MACD Intraday Trend
Combining MACD Intraday Trend with chart patterns and volume analysis techniques can provide traders with valuable insights into market trends and potential breakouts.
Chart patterns such as accumulation and distribution, breakout and breakdown, and inverted head and shoulders can be confirmed and identified with the help of MACD Intraday Trend.
For instance, by analyzing the chart pattern of accumulation and distribution, traders can examine the buying and selling pressure in the market.
If the MACD histogram shows an uptrend, it could confirm the accumulation of buying pressure and signal a potential breakout to the upside.
Similarly, volume analysis can be used to confirm trend patterns and identify market strength.
High volume during a trend can indicate a strong market trend and provide confirmation for a potential breakout or reversal.
Traders can also use the Relative Strength Index (RSI) in conjunction with MACD Intraday Trend to analyze market trends.
When the RSI shows overbought or oversold conditions, it can confirm potential trend reversals and provide traders with potential entry and exit points.
Chart Patterns and Their Effects on MACD Intraday Trend
| Chart Pattern | MACD Intraday Trend Effect |
|---|---|
| Head and Shoulders | MACD histogram may indicate a trend reversal confirming the formation of the head and shoulders pattern. |
| Cup and Handle | MACD Intraday Trend can indicate a bullish trend, confirming the formation of a cup and handle pattern. |
| Descending Triangle | MACD Intraday Trend may show a bearish trend, confirming the formation of a descending triangle pattern. |
| Double Top | MACD histogram may indicate a potential trend reversal, confirming the formation of a double top pattern. |
When combining MACD Intraday Trend with chart patterns and volume analysis techniques, traders must exercise caution and use additional indicators to confirm their findings.
Utilizing MACD Intraday Trend for Trend Confirmation
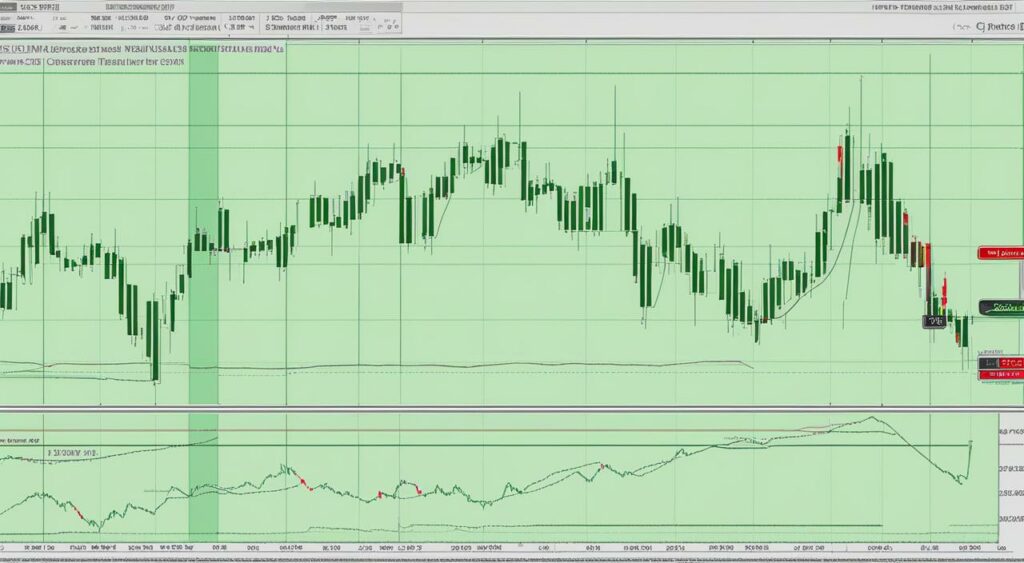
Intraday traders often use MACD Intraday Trend to confirm the direction of a trend. By analyzing chart patterns, traders can distinguish between pullbacks and potential trend reversals.
Some common patterns to look for include:
- Pullback: A temporary reversal in the trend, often caused by profit-taking or market sentiment.
- Retracement: Similar to a pullback, but usually a slightly more prolonged reversal.
- Ascending Triangle: A chart pattern that signals a bullish trend continuation.
- Descending Triangle: A chart pattern that signals a bearish trend continuation.
- Head and Shoulders: A reversal pattern with three peaks, where the middle one is the highest. It signals a trend reversal from bullish to bearish.
- Double Top: A reversal pattern with two peaks, signaling a trend reversal from bullish to bearish.
- Double Bottom: A reversal pattern with two bottoms, signaling a trend reversal from bearish to bullish.
- Cup and Handle: A bullish continuation pattern with a cup-shaped base and small handle.
- Morning Star: A bullish reversal pattern that forms after a downtrend. It starts with a long red candle, then a small body candle, and ends with a long green candle.
- Evening Star: A bearish reversal pattern that forms after an uptrend. It starts with a long green candle, then a small body candle, and ends with a long red candle.
- Gap Up: A situation where the price of a stock jumps up from the previous day’s closing price, without any trading occurring in between.
- Gap Down: A situation where the price of a stock drops from the previous day’s closing price, without any trading occurring in between.
By analyzing these chart patterns and interpreting MACD signals, traders can gain valuable insights into market trends and potential reversal points.
Utilizing MACD Intraday Trend for Trend Confirmation
MACD Intraday Trend can be used in conjunction with other technical analysis tools to confirm trends and identify potential reversal patterns.
Here are some advanced techniques that traders can utilize:
Line Chart, Candlestick Chart, and Heikin-Ashi
Traders can use different chart types, such as line charts, candlestick charts, and Heikin-Ashi charts, to better visualize the trends and patterns in the market.
Line charts are useful for showing trends, while candlestick charts provide a more detailed view of market movements with its bar-shaped representation.
Heikin-Ashi charts are modified candlestick charts that take into account the opening and closing prices of the previous period, resulting in a more smoothed-out representation of price action.
Exponential Moving Average (EMA) and Simple Moving Average (SMA)
Moving averages are commonly used to identify trends and potential reversals in the market.
The exponential moving average (EMA) gives more weight to recent price data, while the simple moving average (SMA) treats all price data equally.
Traders can use these moving averages to identify trends and potential crossovers.
Trendlines and Channels
Trendlines and channels help traders identify the trend and potential support and resistance levels in the market.
Trendlines are drawn by connecting the swing lows in an uptrend or the swing highs in a downtrend.
Channels are formed by drawing parallel lines to connect the swing highs and lows to create a channel.
“Trendlines are one of the simplest, yet most effective, tools used in technical analysis.”
Equilibrium and Demark Indicators
Equilibrium is a state in which the supply and demand for a security are balanced.
Traders can use the DeMark indicators to identify potential trend reversal zones and equilibrium levels in the market.
Money Flow Index
The money flow index is a momentum indicator that measures the flow of money into and out of a security over time.
It can be used to identify potential trend reversals and overbought or oversold conditions in the market.
Intraday MACD Trend Reversal Strategies
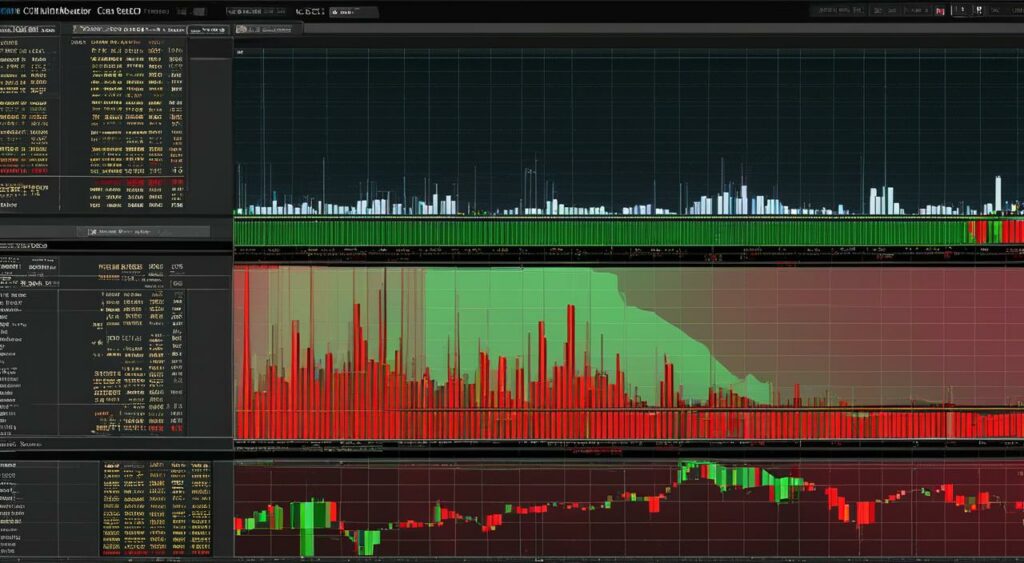
When implementing MACD Intraday Trend in trading strategies, traders often focus on identifying potential trend reversals.
Reversal strategies can be effective in maximizing profits and minimizing losses, but they require precise entry and exit points.
Here are a few intraday MACD strategies for trend reversal:
MACD Bullish Signal Strategy
The MACD bullish signal strategy is used to identify potential trend reversals from bearish to bullish.
The trader looks for a bullish MACD crossover, where the MACD line crosses above the signal line.
This indicates that the stock’s momentum may be turning bullish, and the trader can open a long position.
To confirm the trend reversal, traders can look for other bullish signals such as higher highs and higher lows on the MACD histogram.
The MACD bullish signal strategy can be used in combination with other technical indicators such as moving averages and trendlines to increase accuracy.
MACD Bearish Signal Strategy
The MACD bearish signal strategy is used to identify potential trend reversals from bullish to bearish.
The trader looks for a bearish MACD crossover, where the MACD line crosses below the signal line. This indicates that the stock’s momentum may be turning bearish, and the trader can open a short position.
To confirm the trend reversal, traders can look for other bearish signals such as lower highs and lower lows on the MACD histogram.
As with the bullish signal strategy, the MACD bearish signal strategy can be used in combination with other technical indicators to increase accuracy.
Intraday Trend Analysis
Traders can also use intraday trend analysis to identify potential trend reversals. Intraday trend analysis involves examining price action and volume data to determine the stock’s current trend.
Traders can use the MACD indicator to confirm the trend and identify potential reversal points.
For example, if a stock is in a bearish trend and experiences a bullish MACD crossover, this may indicate a potential trend reversal.
Traders can then look for other bullish signals to confirm the reversal and open a long position.
Trend Confirmation
Trend confirmation is an important aspect of intraday trading strategies. Traders can use the MACD indicator to confirm a trend before entering a position.
For example, if a stock is in a bullish trend and experiences a bullish MACD crossover, this may be a signal to enter a long position.
However, it is important to confirm the trend by looking for other bullish signals such as higher highs and higher lows on the MACD histogram.
Stop Loss and Profit Targets
Stop loss and profit targets are essential for risk management in intraday trading. Traders can use the MACD indicator to set stop loss and profit targets based on trend analysis.
For example, if a trader opens a long position based on a bullish MACD crossover, they can set a stop loss below the recent low.
If the trend continues to be bullish, the trader can set a profit target based on the next resistance level or the previous high.
Implementing MACD Intraday Trend reversal strategies can be a profitable endeavor for traders.
However, it is important to combine the MACD indicator with other technical indicators and risk management techniques for maximum effectiveness.
Enhancing Trading Efficiency with MACD Intraday Trend
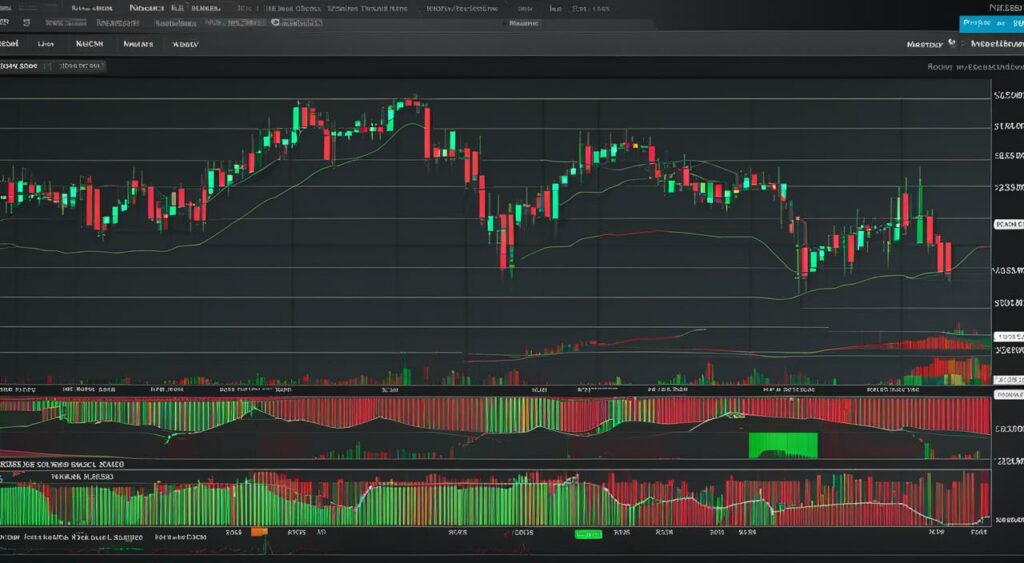
To fully capitalize on the potential of MACD Intraday Trend, traders must adopt an efficient and consistent approach.
Below are valuable tips and techniques that can enhance efficiency in using MACD Intraday Trend:
MACD Crossover Strategy
One of the most popular MACD Intraday Trend strategies is the crossover strategy.
Traders use MACD crossovers to identify potential buy and sell signals, where the MACD line crosses the signal line.
A bullish MACD crossover occurs when the MACD line crosses above the signal line, while a bearish MACD crossover occurs when the MACD line crosses below the signal line.
By incorporating this technique into trading strategies, traders can increase the accuracy of their trades and minimize the risk of false signals.
Trend Following Strategies
MACD Intraday Trend is an excellent momentum indicator that can help traders follow trends in financial markets.
By incorporating MACD with other trend following indicators such as moving averages, traders can identify and exploit price trends in intraday trading.
Divergence Analysis
MACD divergence occurs when the MACD indicator and the price of an asset move in opposite directions.
Divergence analysis can help traders identify potential trend reversals and confirm existing trends. Traders can use bullish or bearish divergence to identify potential buy or sell signals, respectively.
Using MACD Intraday Signals
MACD Intraday signals can provide valuable insights into potential entry and exit points for traders.
By incorporating different MACD Intraday signals such as crossovers and histogram peaks into trading strategies, traders can enhance their potential for profitable trades.
Trend Analysis Techniques
Traders can use MACD Intraday Trend to identify potential trend reversals and confirm existing trends.
Techniques such as trendlines, channels, and equilibrium analysis can help traders identify potential support and resistance levels and make informed trading decisions.
MACD Trading Tips
To incorporate MACD Intraday Trend effectively into trading strategies, traders should consider the following tips:
- Use multiple time frames to gain a more comprehensive view of the market.
- Adjust MACD settings to suit specific trading styles and markets.
- Combine MACD with other technical indicators such as the Relative Strength Index (RSI) and the Moving Average Convergence Divergence (MACD) histogram for enhanced insights.
- Practice risk management and use stop-loss orders to minimize potential losses.
By considering these tips, traders can enhance their proficiency in using MACD Intraday Trend and increase their potential for profitable trades.
CCI Squeez Indicator

Conclusion
In conclusion, mastering MACD Intraday Trend is a valuable skill for any trader looking to enhance their trading strategies.
By understanding the practical applications and components of the MACD indicator, traders can identify potential entry and exit points in intraday trading with increased efficiency.
Through the incorporation of other technical indicators and risk management techniques, traders can maximize profits while minimizing potential losses.
The use of MACD Intraday Trend in trend confirmation and reversal strategies can further enhance trading efficiency.
Traders are encouraged to download the free MACD indicator and apply the knowledge gained from this article in their intraday trading activities.
With the right tools and skills, traders can gain an edge in financial markets and achieve their trading goals.
FAQ
What is MACD Intraday Trend?
MACD Intraday Trend is a technical analysis tool used in trading strategies to identify potential trends and generate buy/sell signals.
How can MACD Intraday Trend be used in day trading?
MACD Intraday Trend can be utilized in day trading to analyze short-term price movements, identify trend reversals, and generate entry and exit signals.
What are the components of the MACD indicator?
The MACD indicator consists of a histogram, a signal line, and two moving averages. The histogram represents the difference between the MACD line and the signal line.
How can MACD Intraday Trend be incorporated into trading strategies?
Traders can use MACD Intraday Trend by analyzing signal line crossovers, histogram patterns, and divergence to identify potential trading opportunities.
How can traders maximize profits with MACD Intraday Trend?
By combining MACD Intraday Trend with other indicators and concepts, traders can enhance their profitability and improve their trading decisions.
What is the importance of risk management and stop loss in MACD Intraday Trend?
Risk management and stop loss techniques are crucial in controlling potential losses and protecting profits when using MACD Intraday Trend.
How can MACD Intraday Trend be combined with chart patterns and volume analysis?
MACD Intraday Trend can be used to confirm chart patterns, analyze volume, and identify potential breakouts or breakdowns in the market.
Can MACD Intraday Trend be used to confirm trends and identify potential reversals?
Yes, MACD Intraday Trend can be utilized to confirm trends and identify potential reversal patterns, providing traders with valuable insights.
Are there any advanced techniques that can be used with MACD Intraday Trend?
Advanced techniques include using different chart types, incorporating moving averages, and exploring additional indicators to enhance trading strategies.
How can MACD Intraday Trend be used to develop trend reversal strategies?
Traders can utilize MACD Intraday Trend signals and trend analysis techniques to identify potential trend reversals and develop effective trading strategies.
How can traders enhance their trading efficiency with MACD Intraday Trend?
Traders can enhance their trading efficiency by utilizing MACD crossovers, trend following strategies, divergence analysis, and incorporating MACD with other technical indicators.




Leave a Reply